
 Home
Home News
News
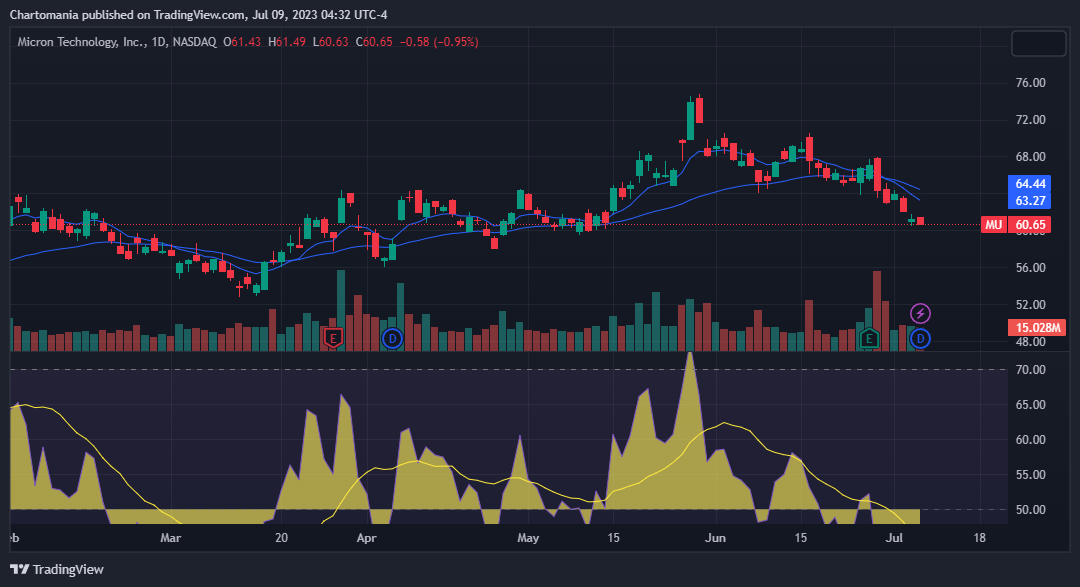
- 1 Micron Technology Inc. (NASDAQ: MU) stock price shed 0.76% on July 7.
- 2 In the past 52 weeks, MU stock’s peak price was $74.77, and its lowest trading price was $48.43 at $48.43.
Micron Technology Inc. (NASDAQ: MU) lost 0.76% of its trading price on July 7 trading session; it opened trading at $61.43, lowering to $60.63 it hit a high of $61.49 and closed trading at $60.65 with an intraday trading volume of 15.028 Million.
Last week, MU stock price fell 5.96% and in a month, the drop was 11.34%. However, over the quarter, its prices surged 6.50%, and in the six months trading session, it reflected an upper movement of 9.42%.

TradingView technical indicators suggest strong selling, and analysts have different opinions and suggest buying. The annual price target of MU stock is $76.88, which is 26.76% higher than the current trading prices.
The stock is back at its May 15 level which is not an alarming fall in price. Essentially, the price action since May 15 was a weak expedition to break above the consolidation zone.
In the past 52 weeks, MU stock’s highest trading price was $74.77, and the lowest traded price was $48.43. The market capitalization of Micron Technology Inc. (NASDAQ: MU) is $66.43 Billion, and the average trading volume is 21.47 Million.
According to TradingView, over 1.089 Billion Micron Technology Inc. (NASDAQ: MU) shares are free-floating, and the remaining 6.623 Million shares are held either by financial backers of the company or by the board of members.
Micron Technology Inc, (NASDAQ: MU) Earnings & Revenue
In Q1 2023, Micron Technology Inc. (NASDAQ: MU) reported 1.17% less revenue than estimated figures. It was assumed that the company might report $4.13 Billion in revenue in the same quarter, although it reported $4.08 Billion.
Similarly, in Q2, Micron Technology Inc. reported 0.57% less revenue than the estimated figures. The estimated revenue for Q2 was $ 3.71 Billion, but the reported revenue was $3.69 Billion.
In Q3, the company changed its gears and impressed its investors by reporting 2.80% more revenue than the estimated figures the predicted revenue for the quarter was $3.65 Billion.
Earning Per Share of Micron Technology Inc. reflected a declined motion in Q1 and Q2 the company registered -101.79% and -186.26% fewer EPS in both quarters simultaneously. Although in Q3, EPS surged 11.21% more than the estimation.
Micron Technology Inc. (NASDAQ: MU) revenue-to-profit conversion constitutes 45% gross profit, 55% IN Earnings Before Interest, Taxes, Depreciation, and Amortization (EBITDA), and 32% Earnings before interest and taxes (EBIT) and 28% in net income.
Most of Micron Technology Inc’s income is generated from Compute and Networking Business Unit, Mobile Business Unit, Embedded Business Unit, and Storage Business Unit.
The majority of its operations are in the United States, Taiwan, China, Japan, Hong Kong, and other regions of Asia Pacific.
Disclaimer
The views and opinions stated by the author, or any people named in this article, are for informational ideas only and do not establish financial, investment, or other advice. Investing in or trading crypto assets comes with a risk of financial loss.
Steve Anderson is an Australian crypto enthusiast. He is a specialist in management and trading for over 5 years. Steve has worked as a crypto trader, he loves learning about decentralisation, understanding the true potential of the blockchain.


