
 Home
Home News
News
- 1 Alibaba’s stock price increased by 8% over the last 24 hours.
- 2 The Alibaba Group Holding Limited (NYSE: BABA) 52-week price range is $74 – $121.
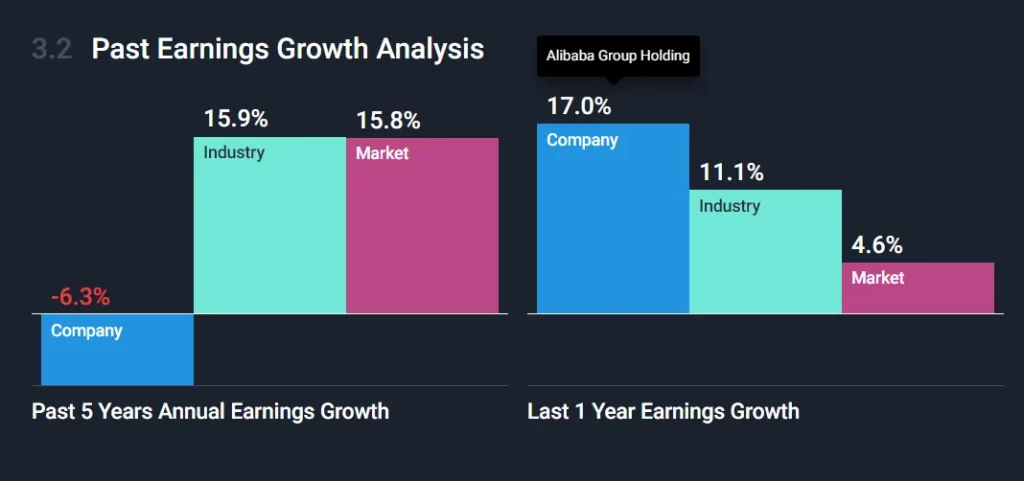
The earnings of Alibaba Group Holding have been dropping by an average of -6.3% every year, while the earnings of the Multiline Retail sector have been increasing by 15.9% yearly. The annual growth rate of revenues is 23.5%. Alibaba Group Holding has a return on equity of 5.8% and net margins of 8.3%.
According to the Alibaba stock price, the stock’s financial health states that the total debt of Alibaba Group Holding is $22.4 Billion and its total shareholder equity is $155.6 Billion, which gives it a debt-to-equity ratio of 14.4%. Its total liabilities and total assets are $87.3 Billion and $242.9 Billion respectively. The EBIT of Alibaba Group Holding is $14.3 Billion, which means its interest coverage ratio is 17.4. It has cash and short-term investments of $72.7 Billion.
The market capitalization of BABA stock is $228.044 Billion, and the total revenue is $126.70 Billion. Moreover, the stock’s basic EPS is $4.02, and the price-to-earnings ratio is 21.03.
Moreover, Alibaba’s stock price highlights this month that the stock performed well as it was up by 5.63%. However, BABA’s price is down by 13.02% over the last six months. Moreover, Alibaba Group Holding Limited (NYSE: BABA) stock’s year-to-date return is slightly negative with a decrease of 0.61% and its overall 1-year return is negative with a decrease of 24.94%.
The price chart of Alibaba’s stock price indicates that the average volume is 16.82 Million and the current volume is 46.992 Million. The volume graph reveals that the current volume is extremely higher than the average volume line and the volume is giving bullish views up ahead until profit booking happens.
Technical Analysis of Alibaba Stock Price in 1-D Timeframe
As per the Alibaba stock price prediction, the price action shows that the Alibaba stock (NYSE: BABA) price saw a sharp drop of about 25% in less than two months and went down from $103.32 to $77.71. Then, the BABA share bounced back from the demand zone and climbed up by around 20% by June 16th, 2023.
However, some peaks in the Alibaba stock price were touching a trendline, and the stock price faced resistance from the trendline and slid 12% in about a month by July 6th, 2023. It was trading at $90.55 at the time of writing. Furthermore, the Alibaba share price is above major EMA’s, which indicates more upward movement in the next few weeks.
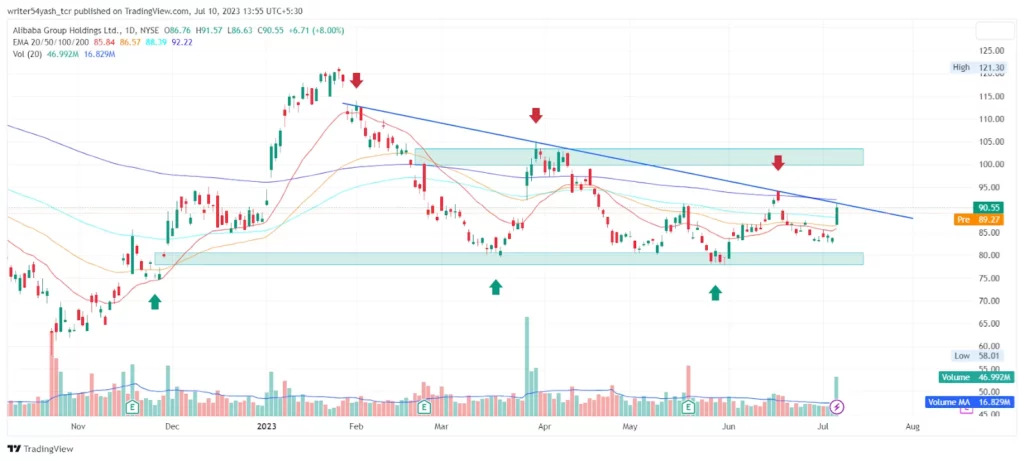
At the time of publishing, the Alibaba (NYSE: BABA) price is trading above the 20, 50, and 100-day EMAs (exponential moving average), which is supporting the price trend. Hence, the stock is expected to move upwards giving bullish views over the daily time frame chart.
However, the stock price remains below the 200-day EMA. To jump over the 200-day EMA, Alibaba stock must accumulate more buyers to surpass the hurdles.
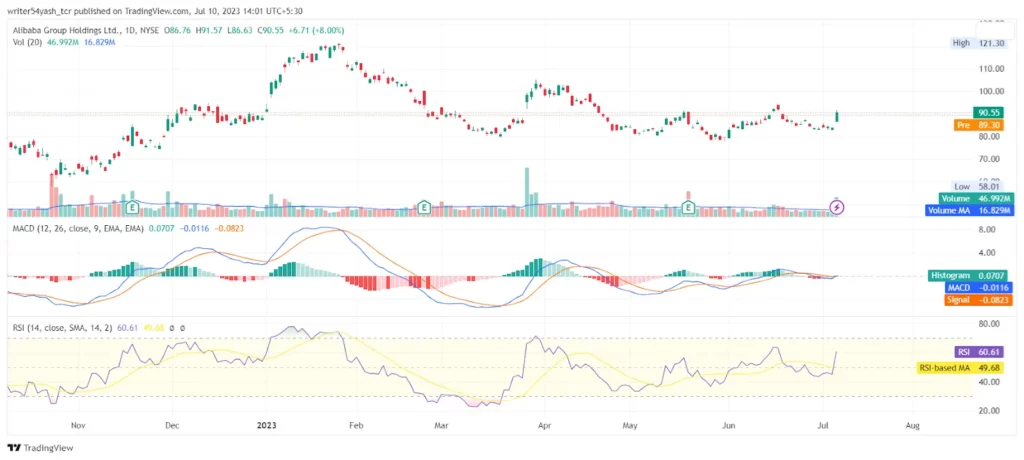
The MACD line at -0.0116 and signal line at -0.0823 is below the zero line but gave a bullish crossover, suggesting bullish signals and may start a new uptrend. The current value of RSI is 60.61 points as it took support on the 14 SMA line and headed upwards. The 14 SMA is near the median line of 49.68 points, indicating upward movement and bullish sentiment in the market.
Summary
Alibaba stock price prediction highlights that the investors and traders of the BABA stock are bullish in the 1D time frame. The technical parameters of the stock suggest the continuation of the uptrend over the daily time frame chart. Moreover, the Alibaba stock is showing signs of bullishness as major indicators – MACD, RSI, and EMA, are giving positive signals and are supporting the price upwards giving bullish views. Therefore, it may be assumed as a bullish view for the upcoming weeks from the day of publishing on the daily time frame.
Technical Levels:
- The nearest support levels: $80.51 and $77.87.
- The nearest resistance levels: $100.06 and $103.48.
Disclaimer
In this article, the views and opinions stated by the author or any people named are for informational purposes only, and they don’t establish the investment, financial, or any other advice. Trading or investing in cryptocurrency assets comes with a risk of financial loss.

Adarsh Singh is a true connoisseur of Defi and Blockchain technologies, who left his job at a “Big 4” multinational finance firm to pursue crypto and NFT trading full-time. He has a strong background in finance, with MBA from a prestigious B-school. He delves deep into these innovative fields, unraveling their intricacies. Uncovering hidden gems, be it coins, tokens or NFTs, is his expertise. NFTs drive deep interest for him, and his creative analysis of NFTs opens up engaging narratives. He strives to bring decentralized digital assets accessible to the masses.


