
 Home
Home News
News
- 1 Amazon’s stock price increased by 1.11% over the last 24 hours.
- 2 The Amazon.com, Inc. ( NASDAQ: AMZN ) 52-week price range is $81 – $131.
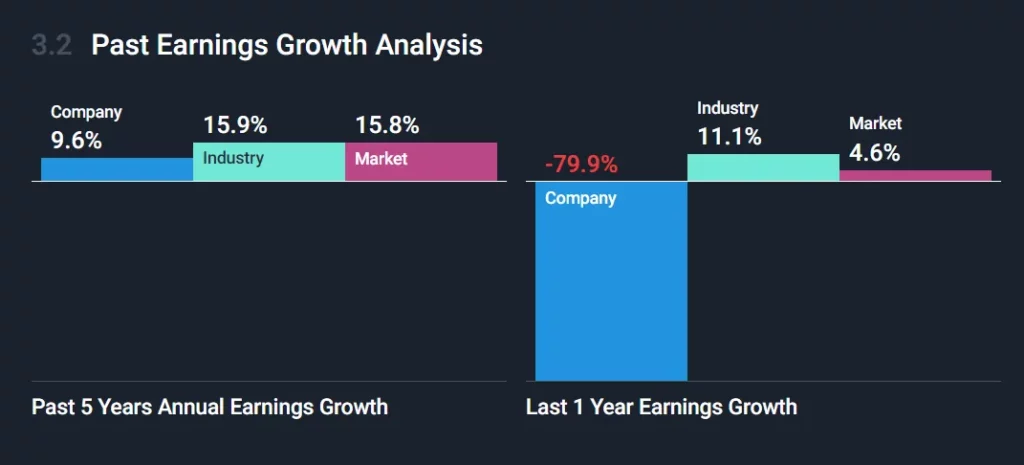
The earnings of Amazon.com have been increasing by an average of 9.6% every year, while the earnings of the multiline retail sector have been increasing by 15.9% yearly. The annual growth rate of revenues is 20.5%. Amazon.com has a return on equity of 2.8% and net margins of 0.8%
According to the Amazon stock price prediction, the stock’s financial health states that the total debt of Amazon.com is $92.9 Billion and its total shareholder equity is $154.5 Billion, which gives it a debt-to-equity ratio of 60.1%. Its total liabilities and total assets are $309.9 Billion and $464.4 Billion respectively. The EBIT of Amazon.com is $13.3 Billion, which means its interest coverage ratio is 10.9. It has cash and short-term investments of $64.4 Billion.
The market capitalization of AMZN stock is $1.332 Trillion and the total revenue is $513.98 Billion. Moreover, the stock’s basic EPS is $0.42 and the price-to-earnings ratio is 311.40.
Moreover, AMZN price prediction highlights that the stock performed well this month as it was up by 2.18%. It was also up by 56.30% over the last six months. Moreover, Amazon.com, Inc. (NASDAQ: AMZN) stock’s year-to-date return is positive with an increase of 51.86%. The overall 1-year return of the stock is positive with an increase of 13.99%.
The price chart of AMZN stock price indicates that the average volume is 54.249 Million and the current volume is 41.992 Million. The volume graph reveals that the current volume is below than the average volume line and the volume is giving bearish views up and a future sign of profit booking might happen soon.
Technical Analysis of AMZN Price in 1-D Timeframe
As per the AMZN price prediction, the price action shows that the AMZN stock (NASDAQ: AMZN) price, at the time of publishing the Amazon (AMZN) stock is trading at $129.78. Furthermore, in the past, a bullish pattern formed which gave a breakout and since then the stock is in an uptrend by creating higher highs and higher lows. But, the candles are shrinking on a daily chart and the volume is also shrinking, which indicates a loss of momentum. The stock requires more buyers to gain momentum.
Amazon stock is attempting to maintain itself at high levels. However, the price has increased by 30% without any pullback, which implies that a correction is expected in the stock. It could be a correction in time by consolidating or in the price by taking a pullback in price. So, it seems a correction might happen soon in the stock.
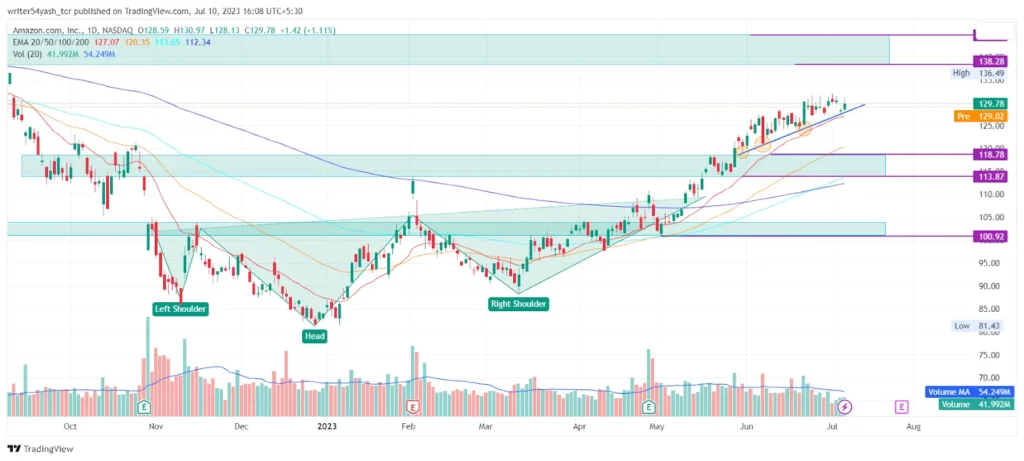
At the time of publishing, the price of Amazon.com, Inc. (NASDAQ: AMZN) is above the 20, 50, 100, and 200-day EMAs (exponential moving average), which are supporting the price trend. However, the price is close to the 20 EMA, which could break if profit booking occurs. Therefore, the stock price is likely to move upward until the profit bookings. If profit booking happens, then the views on the daily time frame chart will become bearish.
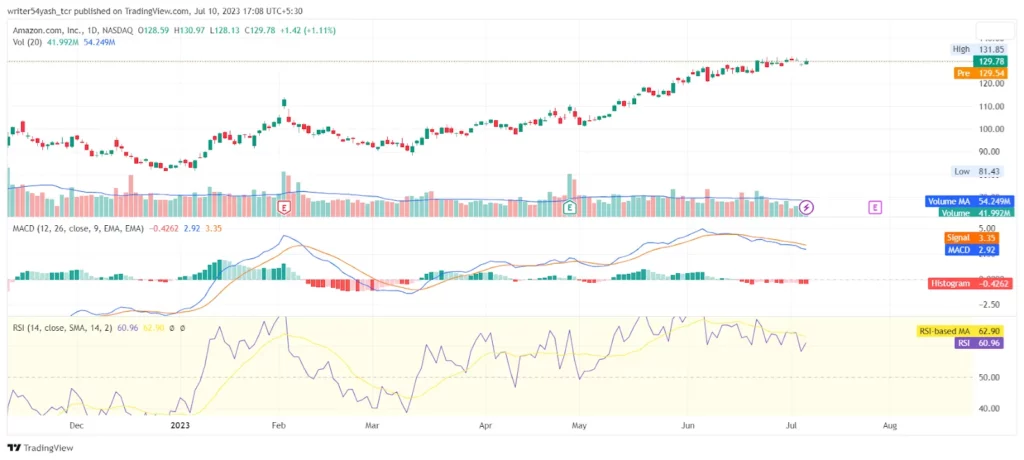
The MACD line at 2.92 and signal line at 3.35 is below the zero line and gave a bearish crossover, suggesting bearish signals and may start a new downtrend. The current value of RSI is 60.96 points as it took rejection from the 14 SMA line. The 14 SMA is above the median line of 62.90 points which indicates a good window towards the oversold territory.
Summary
Amazon Stock Price prediction shows that the AMZN stock investors and traders are bearish in the 1D time frame. The technical factors of the stock indicate the upcoming downtrend on the daily time frame chart. Furthermore, the AMZN stock is displaying signs of bearishness as major indicators MACD and RSI are giving negative signals and are resisting the price giving bearish views. Therefore, it may be assumed as a bearish view for the next few weeks from the day of publishing on the daily time frame.
Technical Levels:
- The nearest support: $118.78 and $113.87.
- The nearest resistance: $138.28 and $144.69.
Disclaimer
In this article about Amazon Stock Price, the views and opinions stated by the author, or any people named are for informational purposes only, and they don’t establish the investment, financial, or any other advice. Trading or investing in cryptocurrency assets comes with a risk of financial loss.

With a background in journalism, Ritika Sharma has worked with many reputed media firms focusing on general news such as politics and crime. She joined The Coin Republic as a reporter for crypto, and found a great passion for cryptocurrency, Web3, NFTs and other digital assets. She spends a lot of time researching and delving deeper into these concepts around the clock, and is a strong advocate for women in STEM.


