
 Home
Home News
News
- 1 COST Stock dropped 2.29% on July 7, 2023, and 1.71% in a week.
- 2 Costco Wholesales Corp. attributes the sales drop to a deflation in gas prices.
Costco Wholesale Corp. (NASDAQ: COST) reported net sales of $22.86 Billion in June 2023, & COST Stock price dropped 2.29%. Last month’s sales hiked by 0.4% from $22.78 Billion in June 2022. Experts believe a drop of over 2% in share price is due to a drop in-store sales and gas prices.

Costco Wholesale Corp. (COST Stock) – Financial Analysis
Costco reported that comparable store sales dropped by 1.4% in June 2023, with 2.5% in the United States and 0.6% in Canada. However, global sales increased by 4.5%. The wholesale company hinted that a deflation in gas prices harmed their sales. International selling price fell by 24% per gallon from June 2022.
Costco Wholesale Corp. operates around 855 warehouses, of which 587 are in the U.S. and Puerto Rico. Canada has 107, Japan has 29, Mexico has 40, United Kingdom has 29, & Korea has 18. Also, there are 15 in Australia, with China and Spain having 14 warehouses each.
At press time, COST Stock is trading at $525.05 with a drop of 2.29%; previous close and open were at $537.37 and $533.89, respectively. The 52-week range is from $447.90 to $564.75. With an average volume of 1.88 Million shares, the market cap is $232.675 Billion.
The trailing twelve-month (ttm) price-to-earnings (P/E) ratio is 38.29, indicating a fair value. At the same time, the (ttm) earnings per share (EPS) is $13.49. Analysts placed a 2.79 rating for moderate buy and estimated a price target at $549.32 with an upside of 4.6%.

The last earnings were reported on May 25, 2023; they reported earnings of $2.93 and failed to beat the expected value of $3.287 by 10.86%. Per the May 2023 data, revenue gained 2.00% to $53.65 Billion (ttm). Revenue per quarter is reported at $530.44, and the year-over-year (YoY) quarterly revenue growth swelled by 2.00%.
NASDAQ: COST price dropped 1.71% weekly, gained 2.05% monthly, and 8.93% in three months. Moreover, the price rallied 14.64% YTD and 6.70% yearly. Also, the revenue (ttm) is $235.44 Billion. Operating expenses surged by 7.73% to $4.79 Billion, while (ttm) operating margin gets a hike of 3.49%.
Net income fell by 3.77% to $1.30 Billion, net profit dropped by 5.45% to 2.43, and profit margin swelled by 2.55%. Total cash in hand at the end of the most recent quarter (mrq) is $13.71 Billion, while the total debt in a similar time frame is $9.00 Billion.
Costo Wholesale Corp. (COST Stock) – Candle Exploration
There is a visible short-term ascending trend line indicating gains. But the current price is bruising the trendline and could drop to the immediate support point of $505.77. Until the price is above this point, the chances of a rally are high. However, long-term gains can be seen after the price breaks R1, at $539.65, or R2, at $562.99.
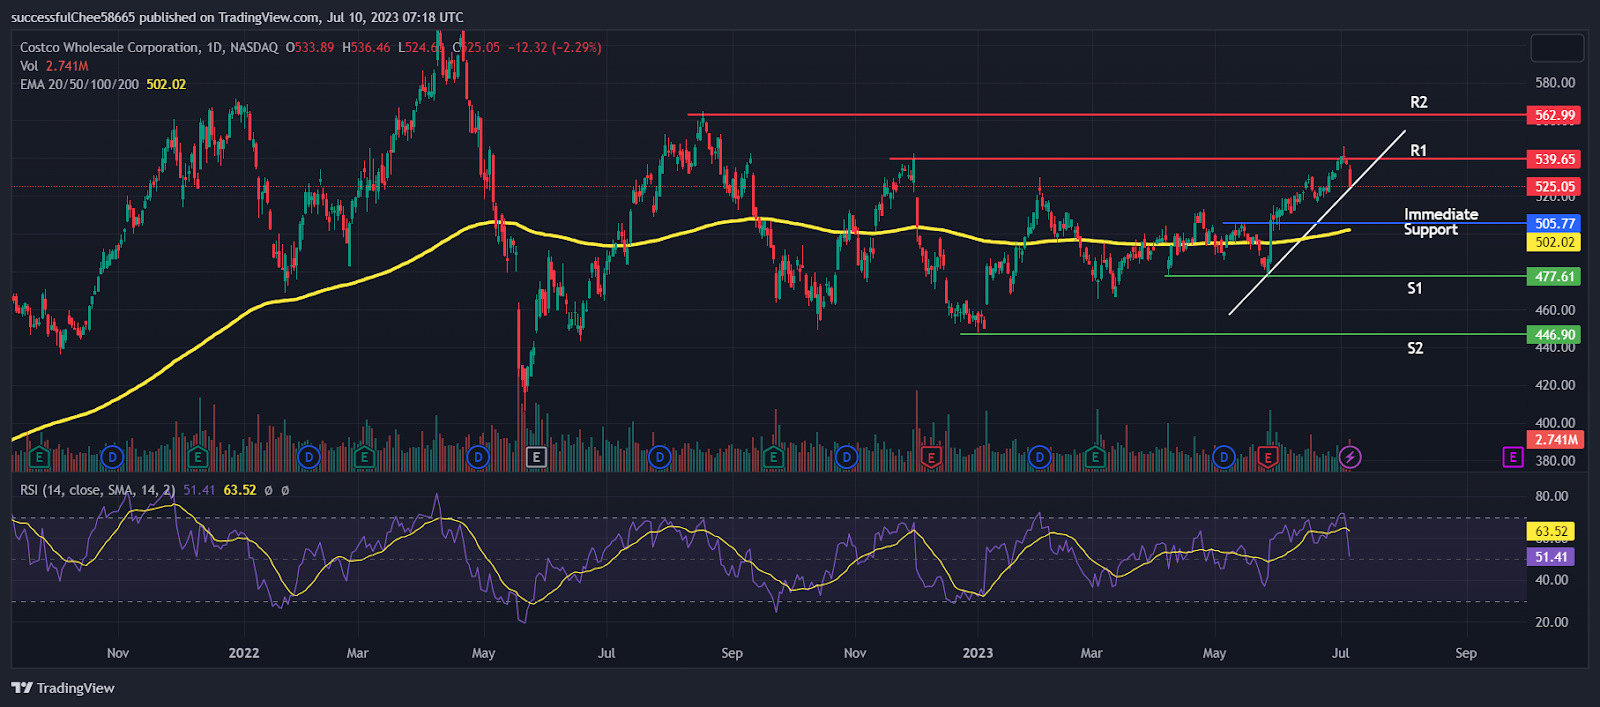
EMA takes an ascending trajectory, but the RSI value of 51.41, though showcasing strength, could act as an anchor slowing the rally. If the price drops below the immediate support, it might touch S1 at $477.61 and bounce back or go to $466.90 for a pullback.
Disclaimer:
The views and opinions stated by the author, or any people named in this article, are for informational purposes only and do not establish financial, investment, or other advice. Investing in or trading crypto assets & stocks comes with a risk of financial loss.
Mr. Pratik chadhokar is an Indian Forex, Cryptocurrencies and Financial Market Advisor and analyst with a background in IT and Financial market Strategist. He specialises in market strategies and technical analysis and has spent over a year as a financial markets contributor and observer. He possesses strong technical analytical skills and is well known for his entertaining and informative analysis of the Financial markets.


