
 Home
Home News
News

- 1 The price of the HT is trading at $2.71 at the present time with a market capitalization of Huobi being $440030223.
- 2 HT price observed a decrease of -0.87% over the last 7 days.
The Huobi has been on a downtrend for a long time and has been dropping from its peak levels and forming lower-low patterns. The coin’s price declined by -0.87% in the last 7 days.
Huobi price has been declining from its high levels and making lower-low structures. It is currently in a downtrend after breaking below the 50-day and 200-day moving averages. However, if it cannot stop the bearish pressure, it may form a new lower-low pattern shortly and prolong the downtrend.

The price data for HT shows that the market sentiments about HT are negative. From its highest price of $39.66, it dropped -93.17% in 2 years, eating into investors’ wealth.
Huobi Technical Analysis
The price of Huobi has slipped below 50-day and 200-day MAs which shows the influence of sellers in the market. However, if sellers continue to drag the market lower, HT coin can suffer more decline and go into a downtrend.
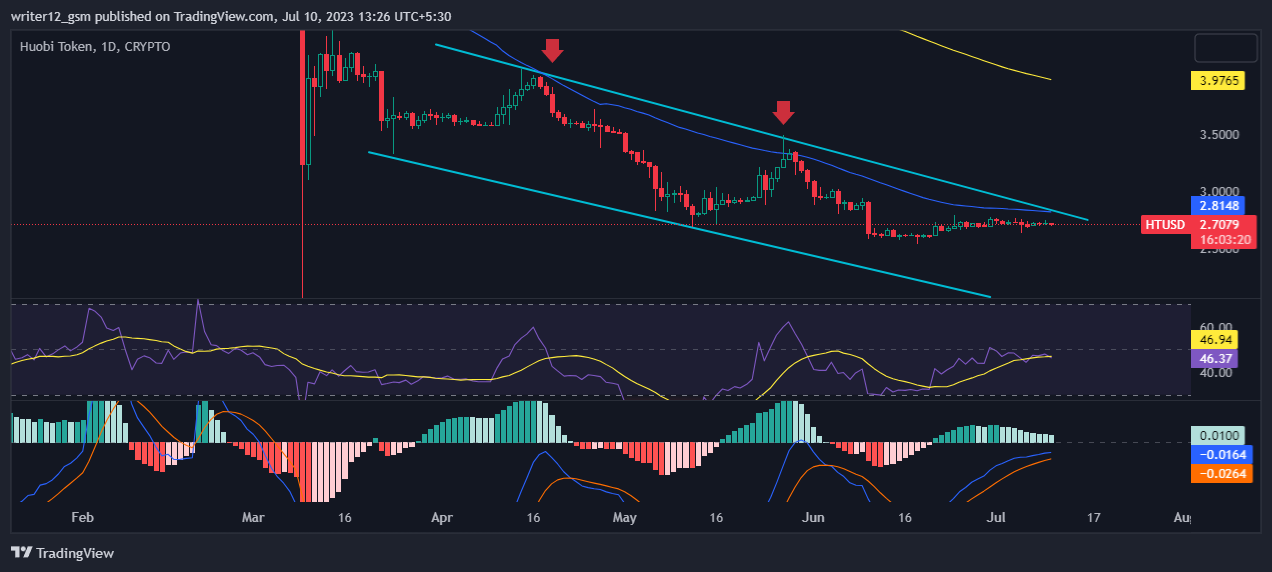
The RSI line has been trading around the oversold area. The RSI line is around 46.91. The 14 SMA has a value of 45.61 points indicating that the Huobi market is heading toward an oversold zone. However, we might see a considerable fall in the price of HT shortly.
Right now, MACD is giving bearish signals. The MACD line at -0.0168 and signal line at -0.0264 is above the zero line, suggesting that the MACD is in positive territory and is giving neutral signals as of now.
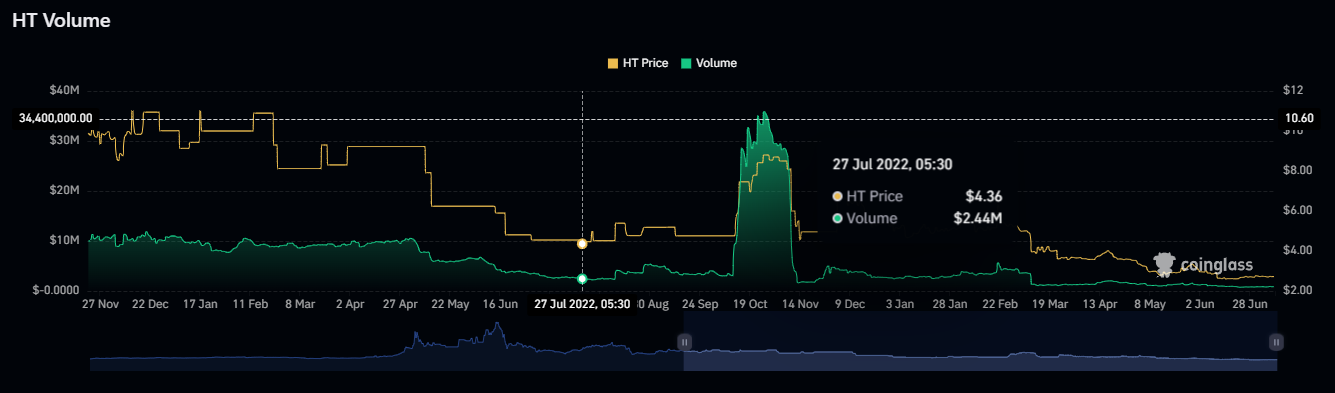
Volume Analysis: The Huobi trading volume of 24 hours is $9756238 with a 10.60% rise in volume in the past 24 hours. There is no significant increase in the volume of the coin and it decreases consistently for a long time. However, the volume chart is indicating that buyers are missing in the market.
Technical Levels:
- Support – The current support levels are $2.491 and $2.227.
- Resistance –The current resistance level is $3.056.
Conclusion
The sellers are dominating on the higher levels and taking multiple rejections from 50 moving averages. However, the technical analysis suggests that Huobi crypto price is in a bearish grip and the probability of making new lows in the coming months remains high. Huobi’s price reflects a negative scenario at the moment.
Major trustworthy indicators like EMA, RSI, and MACD are giving bearish signals about the Huobi coin. The current scenario requires traders and investors to be patient and look for the big picture before making any moves and avoid the fear of missing out to minimize losses.
Disclaimer
The analysis given in this article is for informational and educational use only. Do not use this information as financial, investment, or as trading advice. Investing and trading in crypto is a risky task. Please consider your circumstances and risk profile before making any investment decisions.

Nancy J. Allen is a crypto enthusiast, with a major in macroeconomics and minor in business statistics. She believes that cryptocurrencies inspire people to be their own banks, and step aside from traditional monetary exchange systems. She is also intrigued by blockchain technology and its functioning. She frequently researches, and posts content on the top altcoins, their theoretical working principles and technical price predictions.


