
 Home
Home News
News
- 1 Chainlink (LINK) is trading at $6.16 with a minor rise of 0.93% in the previous trading session.
- 2 Chainlink creates uncertainty between traders now although it is stuck between 200 and 50-Day Moving Average.
Chainlink (LINK) is a cryptocurrency platform that allows non-blockchain companies to securely connect with blockchain platforms. Chainlink acts as a bridge between blockchain-based smart contracts and external data sources, such as sports scores or stock prices.
Chainlink is powered by a decentralized network of oracles that provide reliable data and computation services to smart contracts on any blockchain. LINK is the token used to compensate node operators that retrieve data, perform calculations, and ensure security for the companies.
Chainlink is facing resistance from the level of 6.705, where a 200-day moving average lies, and is moving towards the 50-day moving average. This indicates an uncertain state. Traders and investors should wait for a clear signal for their next move. The crypto is not in a trading zone right now. The next move will depend on whether the crypto breaks out or breaks down from here.
Chainlink Technical Analysis
The price of LINK has stuck between 50 and 200 MA, which suggests that the price is in a neutral state. The crypto could increase in price in the forthcoming week. If the buyers resume driving the price upwards, it will increase more in value.
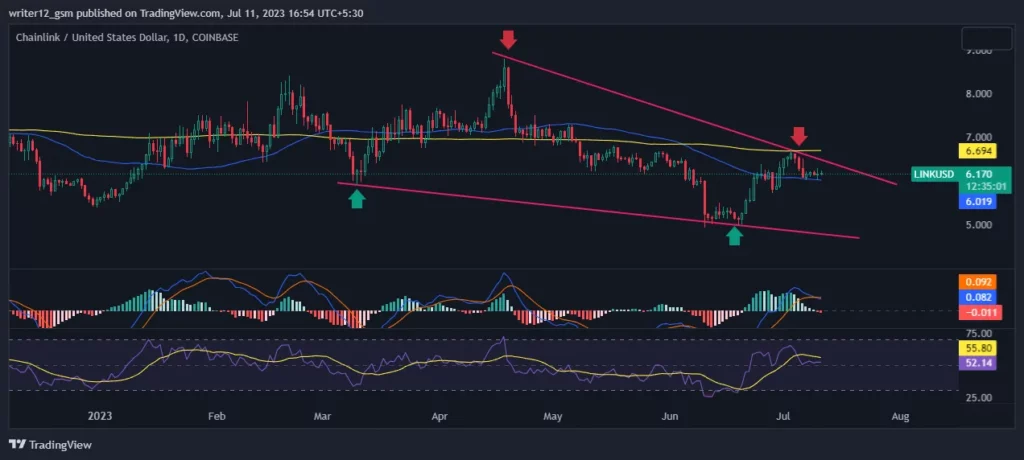
The MACD indicator is still in the positive zone but declining. The MACD line is below the signal line at 0.081 and 0.092 respectively, above the zero line, indicating a bullish momentum turning bearish.
The RSI value is 52.05 points, and the 14-day SMA line is near the middle line, around 55.79 points, which shows a balanced market. The 14-day SMA line is moving down from the middle line toward the oversold zone.
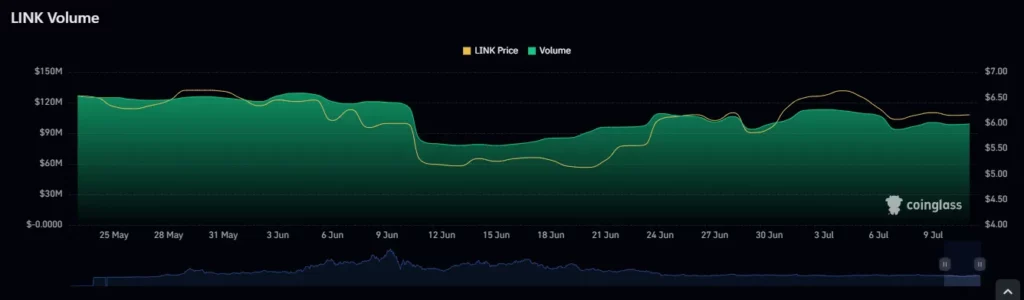
The current price of Chainlink (LINK) is $6.16, with a 24-hour trading volume of $103644893. Chainlink is down 0.80% in the last 24 hours. The live market cap of LINK is$3,192692204.
Summary
Chainlink (LINK) is attempting to recover from the current support level. It appears that a break above the 200-day resistance level could trigger the start of a bullish trend in the near future. However, LINK’s price is in a sideways situation right now because it is trading within the range of the 50 and 200-day moving averages. Meanwhile, major reliable indicators such as EMA, RSI, and MACD give mixed signals about LINK. Due to the poor performance of the crypto, investors are hesitant to invest in it.
Technical Levels:
Support – The current support level is $5.909.
Resistance –The current resistance level is $6.925.
Disclaimer
The analysis given in this article is for informational and educational use only. Do not take this information as financial or trading advice. Trading and investing contain financial risk. Before making any investment or trading decision, please consider your risk profile and circumstances.

Andrew is a blockchain developer who developed his interest in cryptocurrencies while pursuing his post-graduation major in blockchain development. He is a keen observer of details and shares his passion for writing, along with coding. His backend knowledge about blockchain helps him give a unique perspective to his writing skills, and a reliable craft at explaining the concepts such as blockchain programming, languages and token minting. He also frequently shares technical details and performance indicators of ICOs and IDOs.


