
 Home
Home News
News

- 1 MA stock showcased bullishness and persisted in holding the gains over the top.
- 2 Bulls are accumulating the stock and preparing to surpass $400 in the following sessions.
Mastercard stock (NYSE: MA) price is forming a cup and handle pattern where the neckline of $495 is near to breaking. Moreover, the consecutive gains attained by stock show buyers are gaining traction and are willing to achieve the spot of $400 soon.

Furthermore, the chart formation indicates bulls’ momentum and signals a positive outlook on the charts. However, MA stock is trying to register a breakout soon, and investors have kept an eye on it.
The price action shows a strong chart structure with buyers’ dominance, and long buildup activity was noted in the past trading sessions. Furthermore, sellers were now becoming cautious due to the vertical rally that trapped sellers in the past weeks.
After retesting the base near $300, MA stock continues to beat every ongoing resistance and does not take a break, entering into the buyers’ region.
Mastercard, Inc. is a technology company, which engages in the payments industry that connects consumers, financial institutions, merchants, governments, and business. It offers payment solutions for the development and implementation of credit, debit, prepaid, commercial, and payment programs. The company was founded in November 1966 and is headquartered in Purchase, NY.
At press time, MA stock was trading at $392.16 with an intraday gain of 0.90% showing bullishness on the charts. Moreover, the intraday trading volume was 2.149 Million, and the market cap is $371.446 Billion.
As per stock technicals, MA stock has maintained a strong buy rating, and analysts also gave an overweight rating.
Daily Charts Favouring Buyers
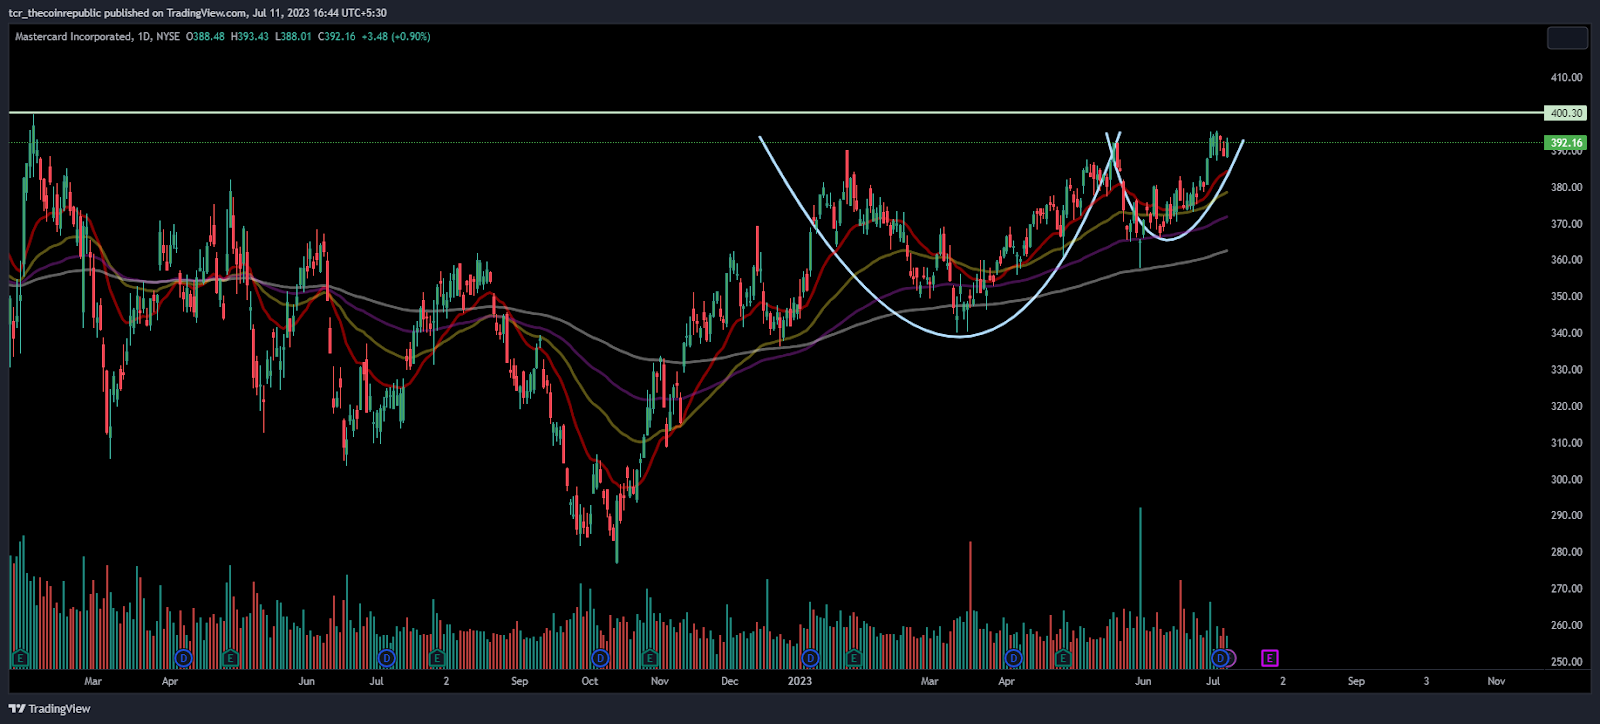
On the daily charts, MA stock showed a breakout of a falling wedge pattern above the neckline of $340 in the past sessions. Afterward, buyers continued to extend the uptrend and head the price above the significant moving averages showing a positive outlook on the charts.
As per the Fib levels, MA stock is trading above the 61.8% level and is near the 78.6% level at $402. Furthermore, leading indicators are starting to suggest early breakout indications, which led to stock price accumulation.
Short Term Charts of MA Stock
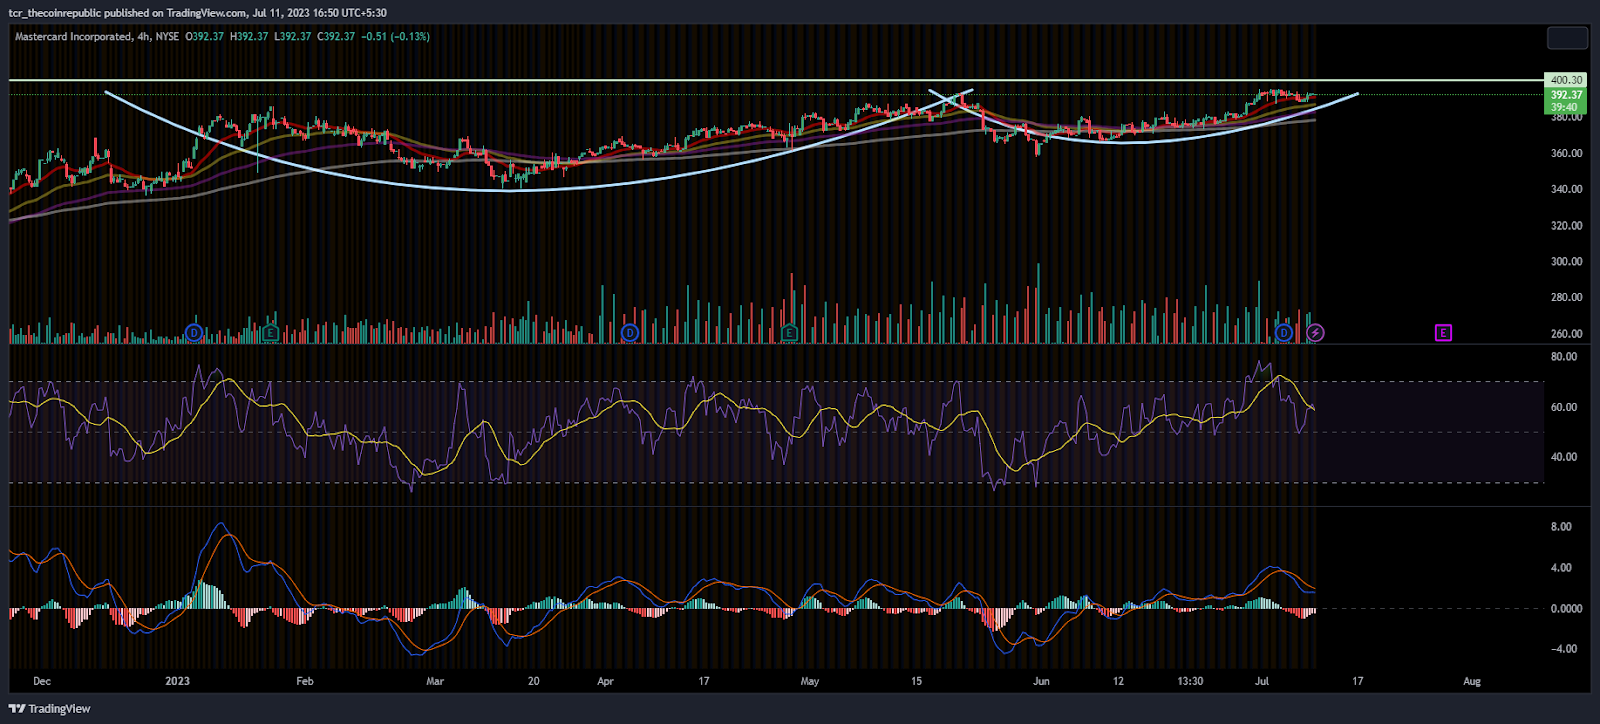
On the 4 hours chart, MA stock showed dividend adjustments in the last sessions, leading to stoppages in the ongoing rally.
Moreover, the stock is near its earnings result for Q2 2023. However, MA stock was in a strong uptrend and maintained a streak of positive earnings reports.
The RSI curve is near 60 in the buying region and showed a positive crossover in the past trading sessions.
The MACD indicator starts to form red bars with a bearish crossover which shows mild profit booking in the last sessions.
Conclusion:
Mastercard stock (MA) price maintains the gains on the top trading beyond its 200-day EMA, signalling a strong trend. Furthermore, the bulls attempt to escape $400 in the following sessions.
Technical Levels
Support Levels: $380
Resistance Levels:$400 and $215
Disclaimer
The views and opinions stated by the author, or any people named in this article, are for informational purposes only and do not establish financial, investment, or other advice. Investing in or trading crypto assets comes with a risk of financial loss.
Mr. Pratik chadhokar is an Indian Forex, Cryptocurrencies and Financial Market Advisor and analyst with a background in IT and Financial market Strategist. He specialises in market strategies and technical analysis and has spent over a year as a financial markets contributor and observer. He possesses strong technical analytical skills and is well known for his entertaining and informative analysis of the Financial markets.


