
 Home
Home News
News

- 1 The AMETEK, Inc ( NYSE: AME) stock price is trading at $157.56 currently with a market capitalization of $36.314 Billion.
- 2 AME stock price observed a decrease of -1.94% over the last 7 days.
Ametek Inc’s price has been on a rising trend for over a month, as the table below shows. The AME price increased by 10.6% from $144.05 on June 1, 2023, to $159.28 on July 7, 2023. The price also reached a new 52-week high of $162.69 on July 6, 2023.
The company delivered record revenue and earnings per share for the first quarter of 2023, surpassing the consensus estimates. The revenue was $1.22 Billion, a 28% increase from the same quarter last year. The earnings per share was $1.08, a 43% increase from the same quarter last year. The company attributed its strong performance to its diverse portfolio of businesses, its operational excellence initiatives, and its strategic acquisitions.

The company raised its full-year guidance for 2023 based on its strong first-quarter performance and its confidence in its growth prospects. The company now expects its full-year revenue to grow by 18% to 20%, compared to the previous guidance of 14% to 16%. The company also estimates its full-year earnings per share to be in the range of $4.32 and $4.44, compared to the previous guidance of $4 to $4.12.
AME Price Technical Analysis
The price of AMETEK Inc (AME) has jumped above the 200-day and 50-day moving averages showing the influence of buyers in the market. However, if buyers continue to push the market higher, AME stock prices can grow more and go into an uptrend. Moreover, the bullish cross confirms the bullish trend.
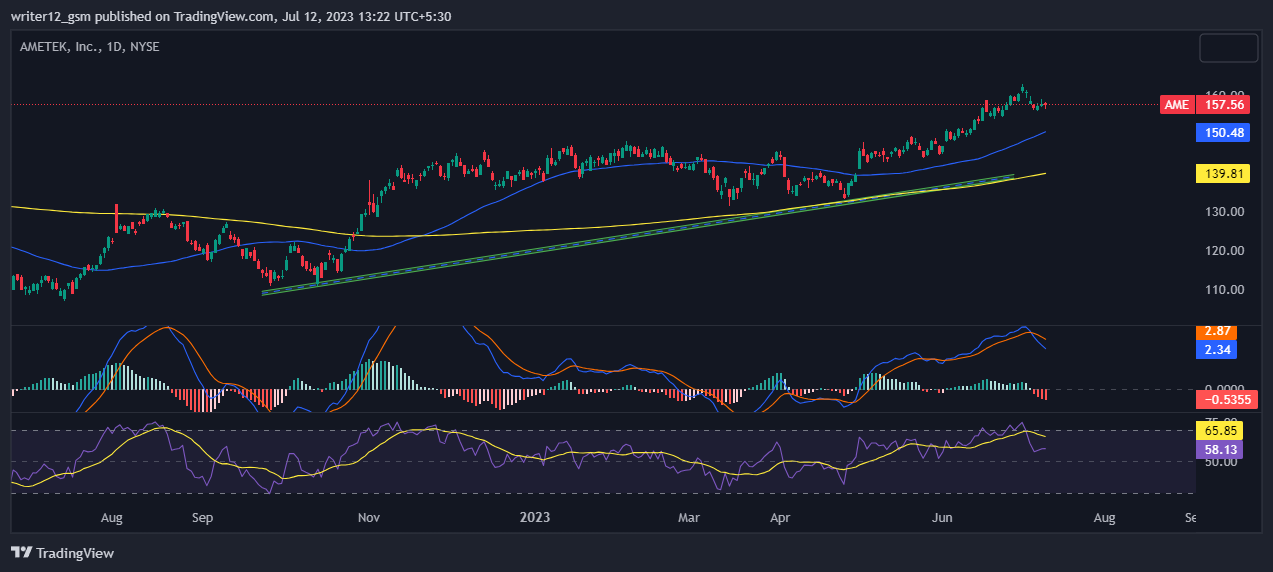
The RSI line has been trading around the oversold area. The RSI line is around 58.13. The 14 SMA has a value of 65.85 points indicating that AMETEK Inc. the market is in the positive zone.
Right now, MACD is giving bullish signals. The MACD line at 2.34 and the signal line at 2.87 is above the zero line, suggesting that the MACD is in positive territory and is giving positive signals as of now.
Conclusion
Based upon the current chart, we can see that the market is trading above the bullish moving average crossover and the RSI is also supporting by sustaining above the 50 levels the MACD has given a bearish but it is also in the bullish territory which in result can lead to a short term retracement in the stock. Hence, AMETEK Inc. stock seems positive based on the charts and we can see higher prices in the upcoming days.
Technical Levels:
- Support – The current support level is $155.41.
- Resistance –The current resistance level is $162.28.
Disclaimer
The analysis given in this article is for informational and educational use only. Do not use this information as financial, investment, or as trading advice. Investing and trading in stock is a risky task. Please consider your circumstances and risk profile before making any investment decisions.
Steve Anderson is an Australian crypto enthusiast. He is a specialist in management and trading for over 5 years. Steve has worked as a crypto trader, he loves learning about decentralisation, understanding the true potential of the blockchain.


