
 Home
Home News
News

Axie Infinity (AXS) price accumulated and rebounded from the base of $4.50 in the previous trading sessions. The chart shows a symmetrical triangle pattern, and the token price trades inside it. However, the price is near the neckline of $6.00, which buyers cannot afford to smash. Moreover, the chart shows seller dominance and rejection multiple times on the top.

The price action of the AXS token showed that selling pressure was noted on the charts and was in a downtrend, forming lower lows over the past few months. Moreover, due to declining investor interest, trading volume was below average.

Furthermore, the AXS GameFi ecosystem showed a decline in user activity which also reacted as a negative sentiment for the token and led to bearishness in the charts.
The ongoing trend favors bears, and the token was also in a corrective phase, which made buyers cautious. Moreover, the AXS token trades below the significant moving averages and tries to attain the 20-day EMA to hold the gains.
At the time of writing, AXS price is trading at $5.98 with an intraday gain of 1.80%, showing a bounce from the lower trendline near the support mark of $5.50. Moreover, the intraday trading volume increased by 3.78% to $34.52 Million. The pair of AXS/BTC is at 0.000194 BTC, and the market cap is $363.73 Million.
Will AXS Price Still In the Sellers Hands
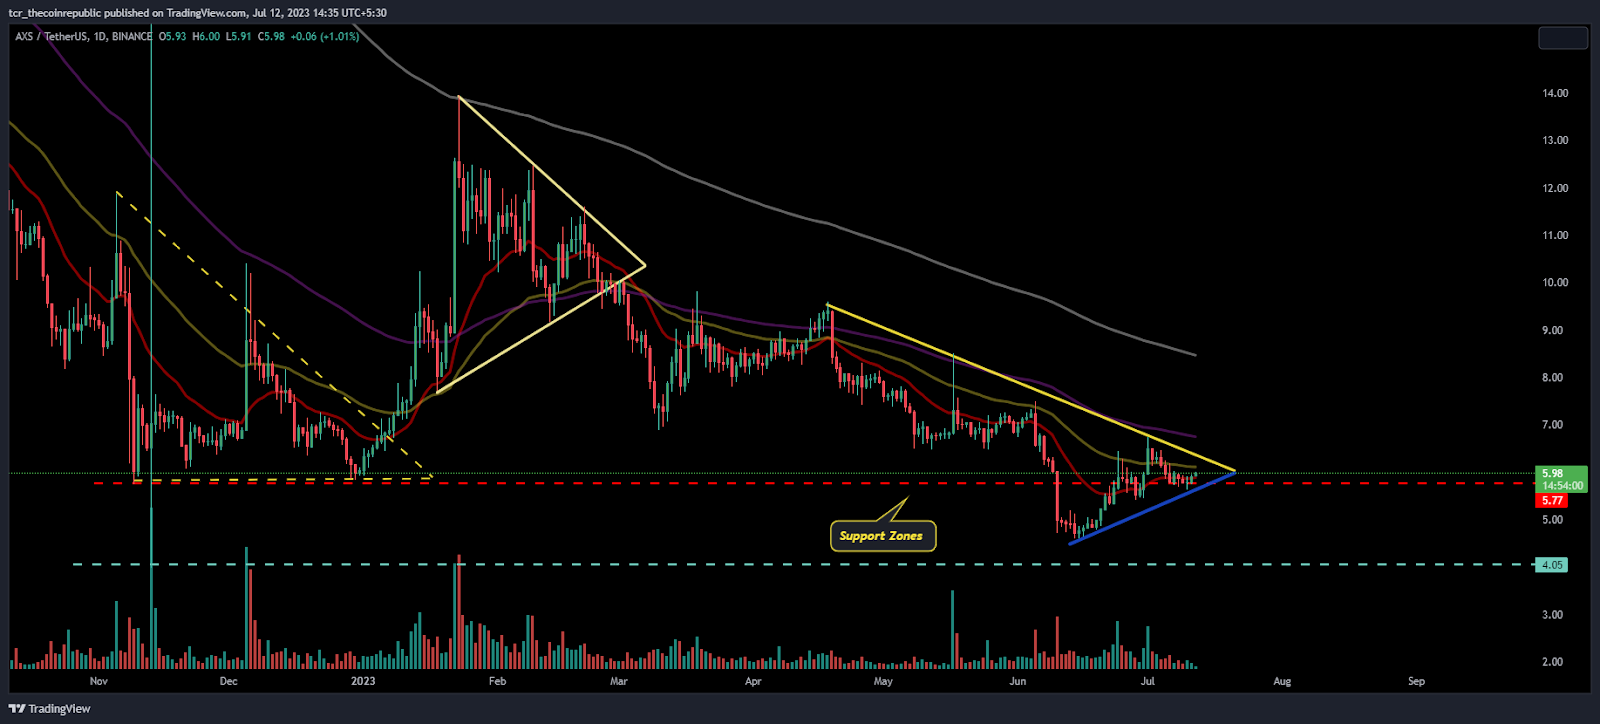
On the daily charts, AXS token price showed a declining move on the charts and lost more than 50% of gains from the start of 2023. Moreover, the price is close to breaking the neckline of the symmetrical triangle pattern. The upper trendline is at $6.10, which, if surpassed, would lead to further rise in buying pressure.
Moreover, as per the Fib levels, AXS is trading below the 23.6% level and is aiming for that level.
What the Technical Indicators Suggest

On the 4-hour charts, the AXS token price is stuck in a narrow range and does not signal an upcoming rise because of low volume levels. Moreover, a key indicator is still in the neutral range and does not signal bullishness.
The RSI curve is near 50, in the neutral range, and showed a narrow consolidation move on the short-term charts.
The MACD indicator still showed green bars on the histogram with a bullish crossover but did not signal any substantial upswing.
Conclusion:
AXS token has traded in a narrow range and is willing to break the range above the 20-day EMA near the round level of $6.00.
Technical Levels:
Support Levels: $5.50
Resistance Levels:$6.30 and $7.00
Disclaimer
The views and opinions stated by the author, or any people named in this article, are for informational purposes only and do not establish financial, investment, or other advice. Investing in or trading crypto assets comes with a risk of financial loss.
Steve Anderson is an Australian crypto enthusiast. He is a specialist in management and trading for over 5 years. Steve has worked as a crypto trader, he loves learning about decentralisation, understanding the true potential of the blockchain.


