
 Home
Home News
News
- 1 Bitcoin is currently trading at $30,607.31, with a price rise of 0.37% in the last 24 hours.
- 2 BTC is in a positive trend and has secured its spot above the important $30500 barrier.
Bitcoin (BTC) impressed the market this month with its resilience. Last week, the BTC technical chart showed a consolidation between a narrow range. Nevertheless, the buyers are trying their best to rebound. If the price breaks the level of $31480, then it is very likely to reach the $35000 mark.
Bitcoin price continues to trade near the major resistance, suggesting that the buyers are in no hurry to book profits as they anticipate another leg higher. This is an early indication of a possible bull run in the upcoming sessions. However, Bitcoin also faces some challenges and risks that could affect its performance.
Bitcoin price dropped by -0.97% over the last seven days. Notably, it tanked 55.37% from its peak price of around $69000 (it’s all-time high) in 12 months. However, the community is bullish about Bitcoin, as per coingecko. Moreover, BTC has some advantages over other cryptocurrencies, such as its network security, adoption rate, and innovation potential.
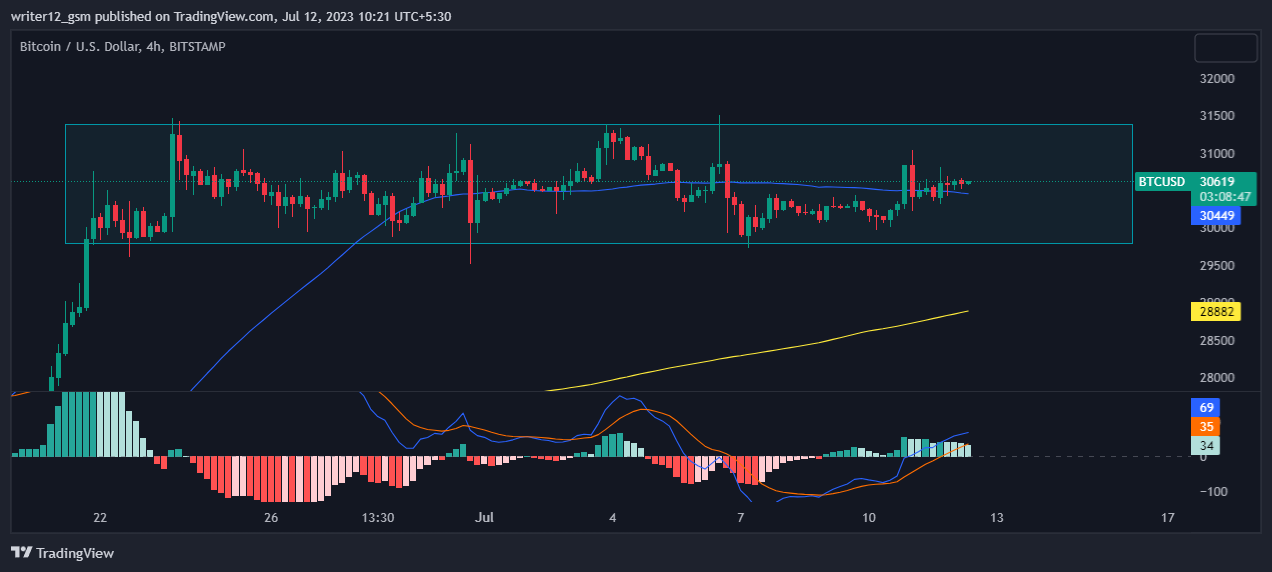
When we take a close look at the 4-hour time frame, we can see that the price is consolidating in a rectangular structure, which is a sign of indecisiveness in the market. The price is bouncing between the upper and lower boundaries of the rectangle and is taking support from the 50-day moving average. The MACD and RSI indicators are heading in an upward direction and hinting at an upward price surge. However, if the price breaks above the rectangle structure, it could trigger a bullish breakout and a new uptrend.
Technical Analysis Of Bitcoin Price
The MACD is in the positive region but the curve is sloping down lightly. MACD reveals that the prices are probable to range bound for some more time. The MACD line is at 606 points, and the signal line is at 727 points on the daily time frame.
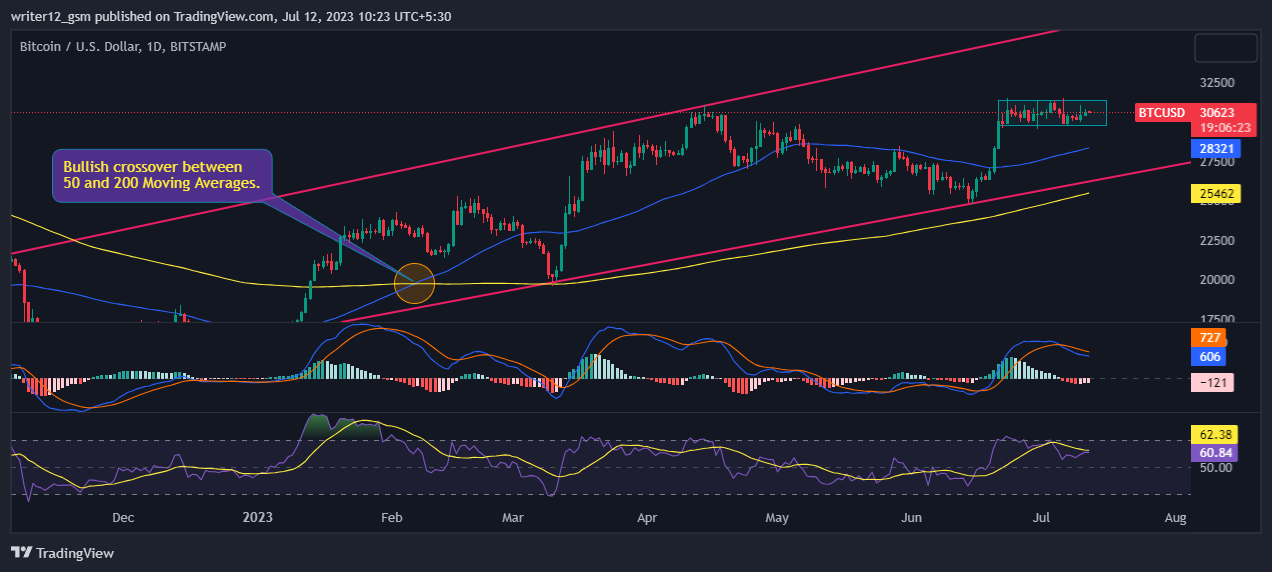
The RSI is near 60.87, and the 14-Day SMA line is at 62.39 points. However, RSI indicates that Bitcoin is in the overbought zone right now.
The Moving Averages are giving a positive outlook. However, the price is above the 50-Day MA and 200-Day MA, indicating Bitcoin is in a bullish trend right now.
Volume Analysis
Bitcoin’s 24-hour trading volume is $8163011917 at press time. Meanwhile, a reduction of -41.40% in volume has been seen in the coin.
Conclusion
BTC price is trading sideways, moving within a tight range. BTC price does not show a clear direction at the moment. Indicators such as RSI and MACD are above the zero line but flattening out, indicating a loss of momentum. The BTC price is finding support on the 50-day MA, which acts as a dynamic support level. The key levels to watch are $31,500 and $29,500, which are the upper and lower boundaries of the range. A break above $31,500 would signal a bullish breakout and a new uptrend. A break below $29,500 would signal a bearish breakdown and a new downtrend.
Technical Levels
- Support – The current support level is $29660.
- Resistance -The current resistance level is $31204.
Disclaimer
The research given in this article is for informative and educational use only. Do not take this information as a financial or trading recommendation. Trading and investing have financial risks. Before creating any investment or trading decision, please consider your risk profile and circumstances.

Andrew is a blockchain developer who developed his interest in cryptocurrencies while pursuing his post-graduation major in blockchain development. He is a keen observer of details and shares his passion for writing, along with coding. His backend knowledge about blockchain helps him give a unique perspective to his writing skills, and a reliable craft at explaining the concepts such as blockchain programming, languages and token minting. He also frequently shares technical details and performance indicators of ICOs and IDOs.


