
 Home
Home News
News
- 1 SUI’s price prediction points at $0.6614, SUI is down by 10.10% in the last 24 hours.
- 2 SUI recorded a 6.66% increase in 24-hour trading volume.
- 3 SUI price is moving within a range, it is consolidating.
SUI price prediction implies that SUI price is presently range bound on the one-day chart. Investors are presently indecisive according to the price action. There is a slight increase in the green volume of sticks which indicates that buyers are stepping up above the bears. With multiple technical indicators giving similar signals in a 4-hour timeframe, the buyers may triumph in this struggle.
Investor sentiments regarding the SUI price may change within the next few weeks. The probability of a bullish recovery may increase substantially if SUI price breaks above this consolidation zone with strong momentum. Investors may look out for the making of a bullish engulfing candle before entering the price action.
The present value of SUI is $0.6614 and it has a market capitalization of around $489.38 Million.
SUI Price Prediction: Technical Analysis On 1 Day Timeframe
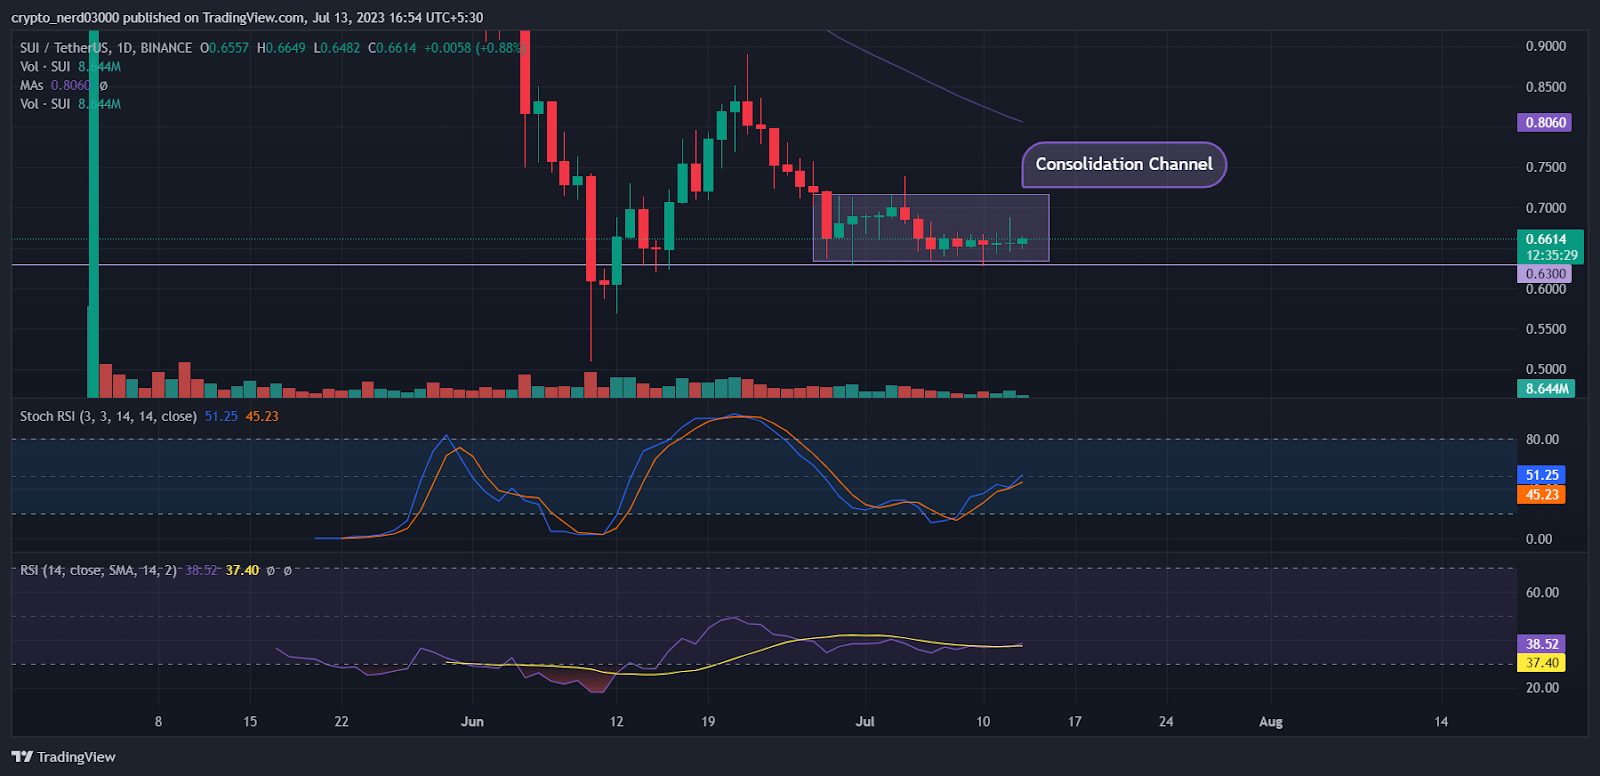
The price patterns made through candlesticks present a possibility of a breakout. The SUI price is making spinning top candles on the 1-day chart. The pattern indicates that bulls and bears are struggling to gain the upper hand in the market.
The exhaustion among the buyers is reflected by the Doji candle whereas the making of these candles after a selloff indicates that there is a decline in selling pressure.
SUI Price Prediction: Technical Analysis On 4h Timeframe

SUI price prediction on the 4h timeframe projects a more precise picture than the daily timeframe. Here the majority of technical indicators are in the bull’s favor. Presently, the 50 EMA is acting as immediate resistance for the SUI token. However, if the price succeeds in breaking this resistance level, it could surge by 10% within a short period.
The RSI oscillator is creating a bullish divergence where the price is moving sideways in a range. The RSI line is making a higher high and low pattern which gives a promising indication for bulls. The current value of RSI is 51.29 points, whereas the 14 SMA is providing support to it at 50.61 points.
The stochastic RSI is also giving an optimistic crossover near the demand zone. The %K line has crossed above the %D line on the 4h timeframe. The present value of stochastic RSI is 32.88 points.
Conclusion
As per the analysis, Investor sentiments regarding SUI price may change within the next few weeks, but at present there is indecisiveness in the market. The oscillators are giving an optimistic outlook. If the price succeeds in breaking this resistance level, it could surge by 10% within a short period.
Technical levels –
Support – $0.6000
Resistance – $0.7500
Disclaimer
The views and opinions stated by the author, or any people named in this article, are for informational purposes only, and they do not establish financial, investment, or other advice. Investing in or trading crypto assets comes with a risk of financial loss.
Mr. Pratik chadhokar is an Indian Forex, Cryptocurrencies and Financial Market Advisor and analyst with a background in IT and Financial market Strategist. He specialises in market strategies and technical analysis and has spent over a year as a financial markets contributor and observer. He possesses strong technical analytical skills and is well known for his entertaining and informative analysis of the Financial markets.


