
 Home
Home News
News

- 1 Eli Lilly and Company stock (LLY) is currently trading at $434.70 with a drop of 5.90% in the last 24 hours.
- 2 The Eli Lilly and Company Stock 52-week range is $296.32 – 469.87.
- 3 The (LLY) market capitalization is $412.649 Billion.
The Eli Lilly and Company stock (LLY) is testing its critical support level and breached the 50-day moving average on the daily time frame. However, the stock has been in an uptrend for a long time so the bulls are unlikely to give up easily.
LLY breaching the 50-MA indicates a bearish trend for the stock. Investors should be patient and wait for a clear signal before making any moves.

By analyzing the price data of the (LLY) stock, it is observed that it is heading downward. The price declined by -6.14% in the last seven days. However, It gave a positive return of 35% in the last 1 year. Eli Lilly and Company stock is performing well till now however as the stock is near a critical support level, caution is advisable.
Eli Lilly and Company Stock (LLY) Technical Analysis
The Eli Lilly and Company stock (LLY) just breach the 50-Day moving average indicating an upcoming bearish trend. The price may decline further in the next week if the selling pressure persists.
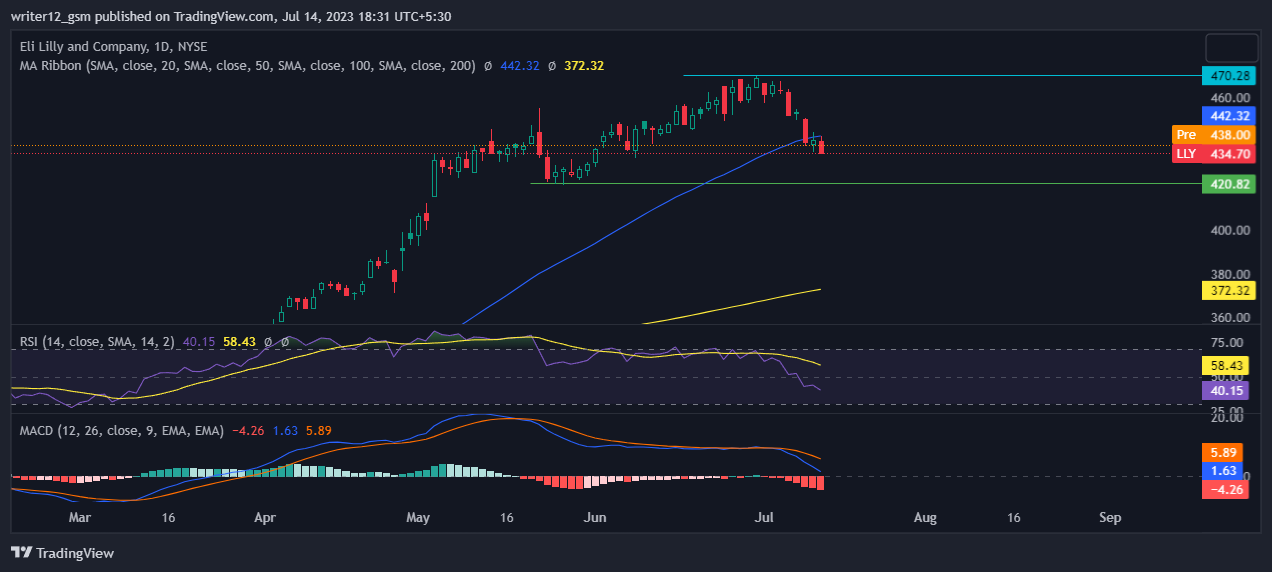
The MACD indicator is heading toward a negative zone. The MACD line at 1.63 and the signal line at 5.89 are around the zero line, implying that the MACD is bearish.
The RSI value is 40.43 points, below the middle of the range. The 14 SMA line is currently above the median line, around 58.43 points, which shows a bearish market sentiment for now.
Volume Analysis: Eli Lilly and Company stock (LLY)’s average trading volume for the last three months is 3.02 Million and the average volume for the last 10 days is 2.62 Million.
Summary
The Eli Lilly and Company stock (LLY) is facing selling pressure. The price may drop further if it breaches the recent support level. The key indicators such as EMA, RSI, and MACD are showing mild bearish signs for the stock. Investors are fearful due to the weak technicals of the share at the moment. An advisable strategy for traders and investors is to wait for a clear break below or above the range before taking any action and avoid the fear of missing out (FOMO) to reduce losses.
Technical Levels:
- Support – The current support level is $420.
- Resistance –The current resistance level is $470.
Disclaimer
The analysis given in this article is for informational and educational use only. Do not take this information as financial or trading advice. Trading and investing contain financial risk. Before making any investment or trading decision, please consider your risk profile and circumstances.
Steve Anderson is an Australian crypto enthusiast. He is a specialist in management and trading for over 5 years. Steve has worked as a crypto trader, he loves learning about decentralisation, understanding the true potential of the blockchain.


