
 Home
Home News
News

- 1 Ethereum is currently trading at $2009.01 with a rise of 7.59% in the last 24 hours.
- 2 ETH’s average trading volume for the last 24 hours is $19,761,381,046. However, it is showing a boost of 117.80% in volume in a day.
Ethereum (ETH) price advanced by 52% in the first quarter of 2023, outperforming Bitcoin, which had a subtle 10% rise. ETH price prediction is bullish, but the price is close to the key resistance of $2140.50 and the buyers are attempting to break it.

Currently, the ETH price has trended above the level of 50 and 200-Day moving averages which obtain an optimistic sentiment for the trader and investors.

ETH price rose by 8.18% in the last seven days and it can be said that the performance was excellent last week. ETH declined by -58.79% from its peak price of $4878.26 in a span of 12 months. However, the current market sentiments are looking positive.
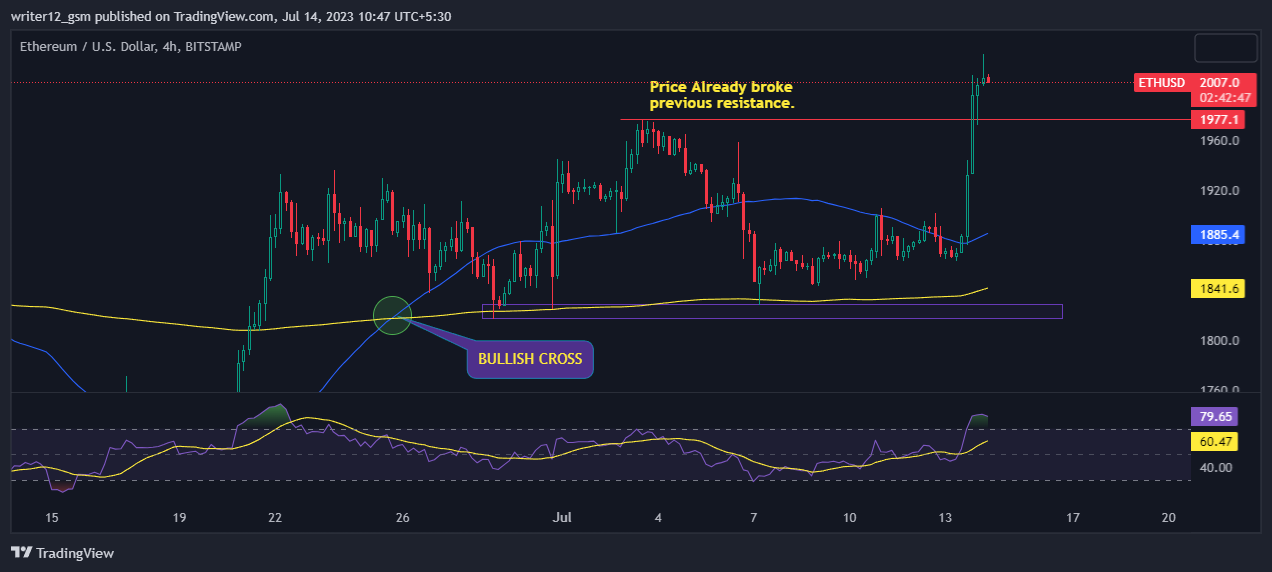
The 4H chart looks promising, with a visible bullish crossover. The MACD indicator is upbeat. However, both the MACD line and the signal line are above zero. The RSI is at 80.44 and the 14-SMA line is 60.52, both in the overbought region, showing that the market is extremely bullish.
Ethereum Price Technical Analysis
The price of Ethereum has been above the 50-day and 200-day MAs, which indicates that the price is in an uptrend. There is a chance that the values will grow even further in the upcoming week if the buyers continue to drive the price up.
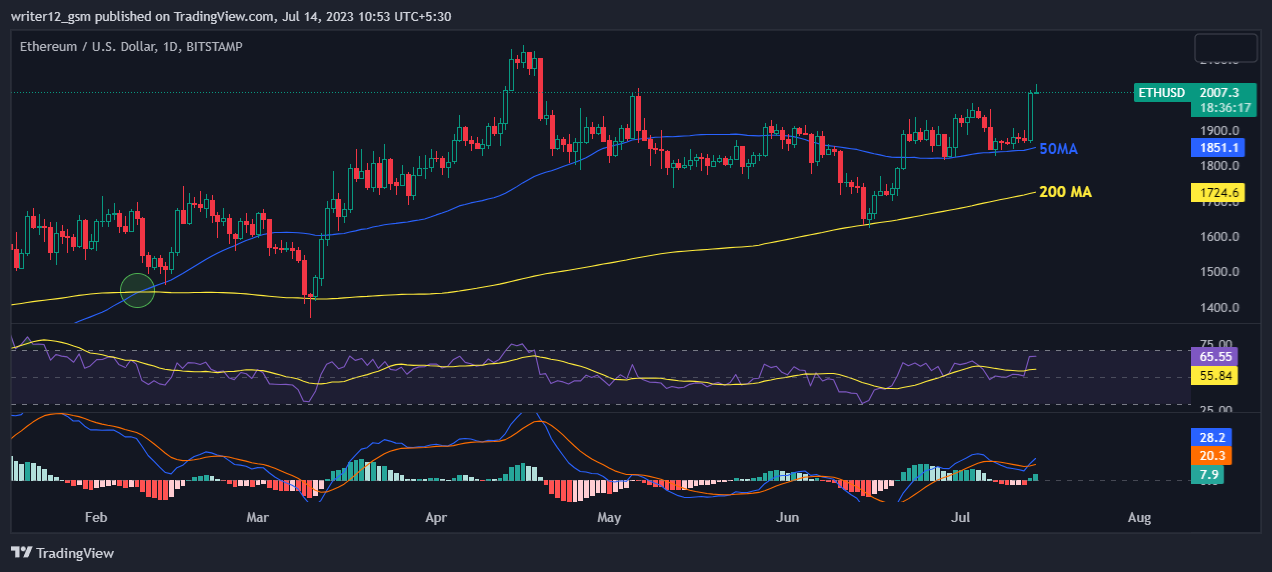
The MACD confirms the positive trend. The MACD line at 28.2 and the signal line at 20.3 are above the zero line, suggesting that the MACD is in a positive region.
The RSI is at 65.53 and the 14-SMA line is at 55.84, close to the overbought zone. The 14 SMA line is beneath the RSI line and moving upwards, indicating that the market sentiment is bullish.
Technical Levels:
- Support – The current support levels are $1826.00.
- Resistance –The current resistance level is $2140.50
Conclusion
ETH crypto price exhibited a notable upward movement last month, gaining more than 52% in Q1, 2023. However, the price action indicates that the price might increase more in the future if it breaks its primary trendline resistance just enough. ETH price shows a bullish scenario at the current moment, as it trades above its 50-day and 200-day moving averages. Major reliable indicators like EMA, RSI, and MACD are giving positive signals about Ethereum (ETH) right now, suggesting that the momentum is strong and the trend is intact.
Disclaimer
The analysis given in this article is for informational and educational use only. Do not take this information as financial or trading advice. Trading and investing contain financial risk. Before making any investment or trading decision, please consider your risk profile and circumstances.

Adarsh Singh is a true connoisseur of Defi and Blockchain technologies, who left his job at a “Big 4” multinational finance firm to pursue crypto and NFT trading full-time. He has a strong background in finance, with MBA from a prestigious B-school. He delves deep into these innovative fields, unraveling their intricacies. Uncovering hidden gems, be it coins, tokens or NFTs, is his expertise. NFTs drive deep interest for him, and his creative analysis of NFTs opens up engaging narratives. He strives to bring decentralized digital assets accessible to the masses.


