
 Home
Home News
News
- 1 Quant is trading at $104.5 while seeing a sharp 12.94% fall in the 24-hour trading volume (press time).
- 2 Quant price recorded a 0.23% increase in the last 7 days.
Quant price prediction suggests that the Quant token is making an attempt to break above the immediate resistance level near the 50 EMA level. It recently took a rebound from the demand zone near $100.0 with a bullish engulfing candle. Presently, the price is forming a red candle though the buyers may prefer to keep a keen watch over the price action as multiple indicators are pointing in the bullish direction.
Observing the historical price action, it can be estimated that QNT token has been retesting the 200 EMA frequently. Hence, it can be estimated that even if the price does not succeed in making the breakout, it will come for a retest through its 200 EMA resistance level which is 10% above the current price near $112.0.
The present value of Quant is $104.5 and it has a market capitalization of around $1.26 Billion (press time).
Exegravent Rise in Lunar Crush Levels: Quant Token
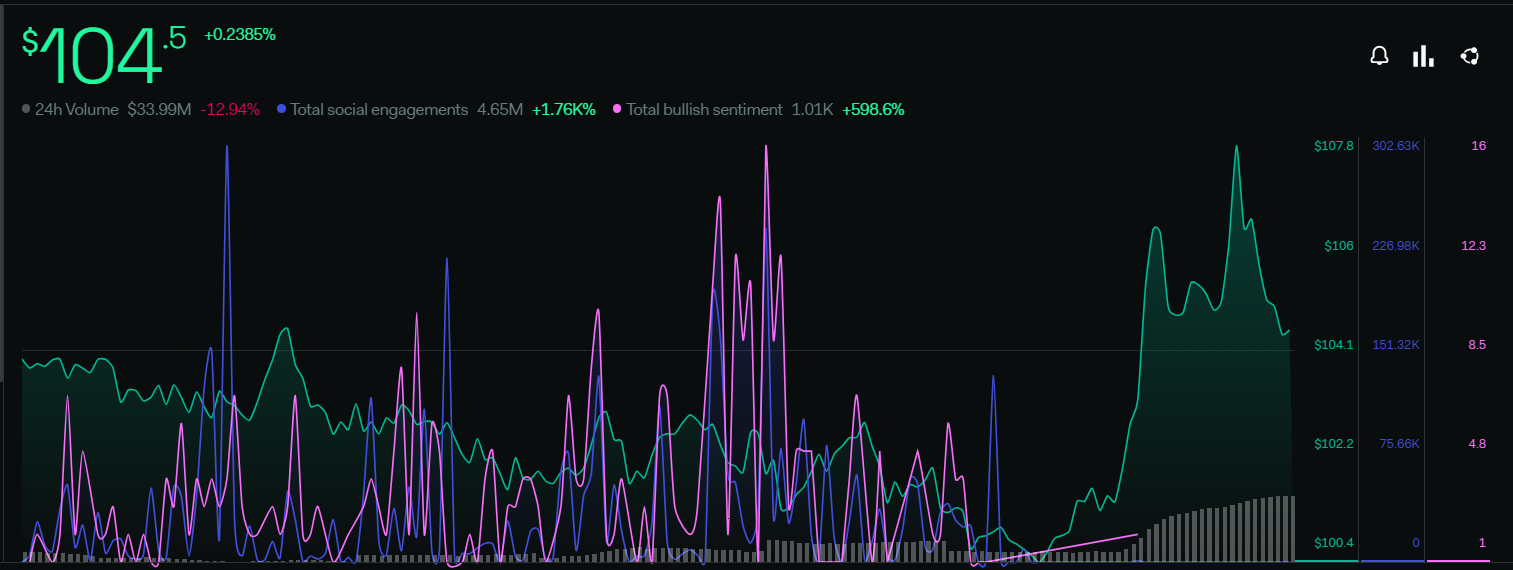
The lunar crush levels are indicating that Quant is hyped up in the community across social media platforms. The majority of the metrics in the platform are flashing in green at present.
The total bullish sentiment metric has surged by 598.6%, and a sharp rise of 1.76K% is also apparent in the total social engagement level. However, a slight fall in the 24h volume suggests a decline in trading activity among investors.
Significant Hike in Greed Sentiment of Investors
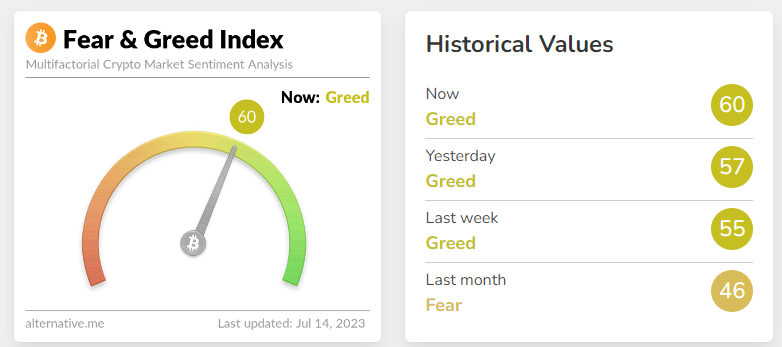
Investor sentiments concerning the overall cryptocurrency market are moving toward the greed zone. The current value of the sentiment index is 60 points and is seeing a 7-point fall within a brief period as per the Alternative(dot)me platform.
Quant Price Prediction: Technical Analysis on Daily Timeframe
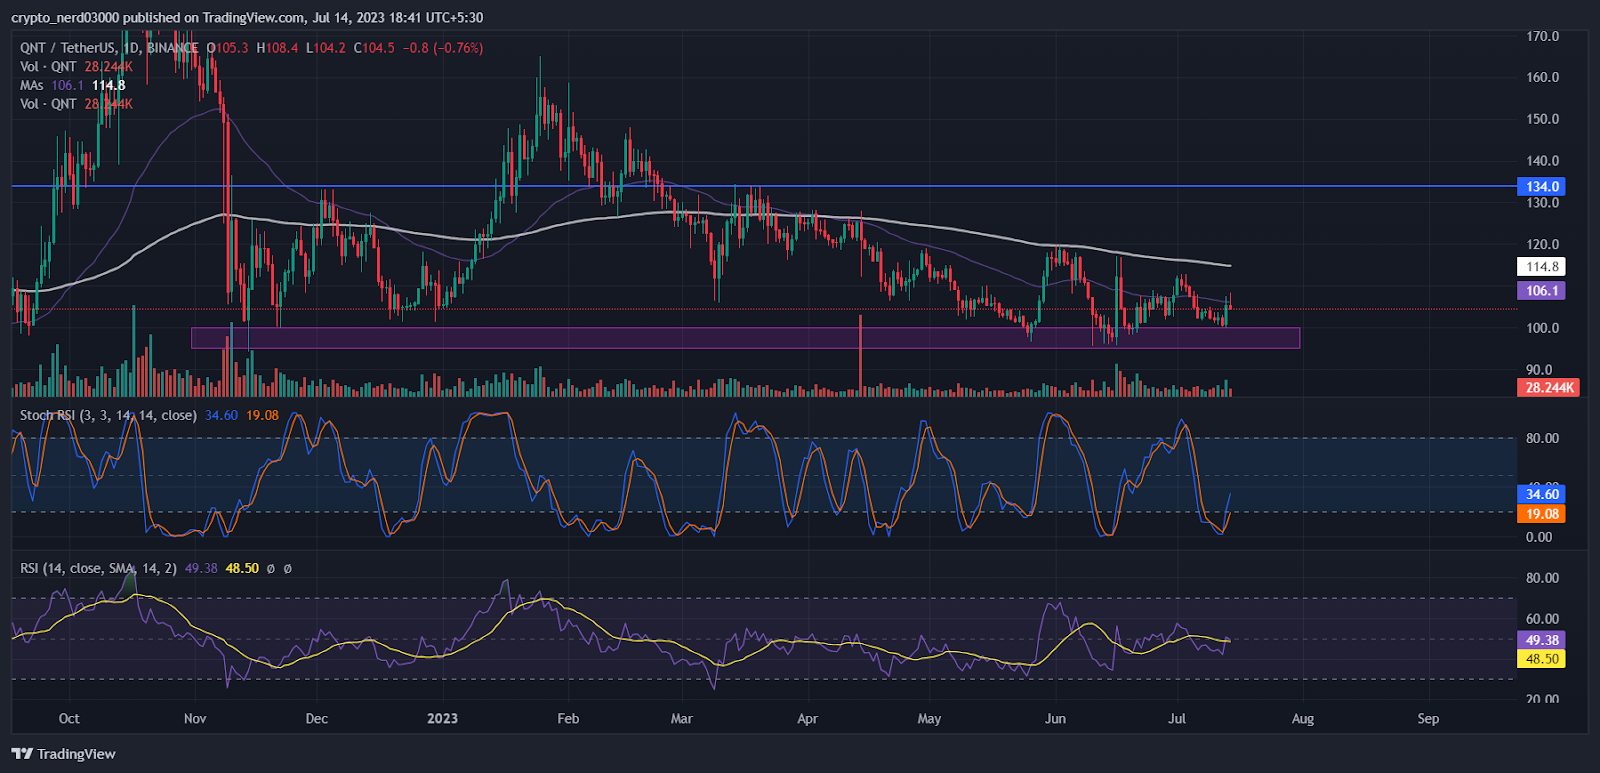
The relative strength index (RSI) line is moving near the median line. The present value of the RSI is 49.38 points and the value of the 14-day SMA is 48.50 points.
At present, the stochastic RSI is progressing toward the supply zone and it may soon cross above the median line. The stochastic RSI is moving near 34.60 points. The %K line approached the median line whereas the %D line is just below it.
Conclusion
As per the analysis, Quant token is taking a rebound from the demand zone on the one day chart. The lunar crush levels suggest that the community is hyped up regarding Quant across social media platforms. The target level for it is 10% above the current price near $112.0.
Technical Levels:
Support – $100.0
Resistance – $112.0
Disclaimer:
The views and opinions stated by the author, or any people named in this article, are for informational purposes only, and they do not establish financial, investment, or other advice. Investing in or trading crypto assets comes with a risk of financial loss.

Andrew is a blockchain developer who developed his interest in cryptocurrencies while pursuing his post-graduation major in blockchain development. He is a keen observer of details and shares his passion for writing, along with coding. His backend knowledge about blockchain helps him give a unique perspective to his writing skills, and a reliable craft at explaining the concepts such as blockchain programming, languages and token minting. He also frequently shares technical details and performance indicators of ICOs and IDOs.


