
 Home
Home News
News
- 1 The Procter & Gamble Company (NYSE:PG) stock is currently trading at $148.95 with a minor rise of 0.07% in the last 24 hours (press time).
- 2 PG’s 52-week price range is between $122.18 – $158.11.
- 3 Procter & Gamble Company’s market capitalization is $351.071 Billion.
The Procter & Gamble Company Investor alert: PT stock is trending downwards. However, PT has been stuck in a narrow-range rising wedge pattern for a long time, which usually leads to a breakdown.
On the fundamental side, PG has a positive earnings per share (EPS) of $5.81 and a positive price-to-earnings (PE) ratio of 24.03. The diluted net earnings per share from continuing operations increased by 5% year-over-year to $1.54 in the second quarter of 2022. PG pays a quarterly dividend of $0.88 per share, with a forward dividend yield of 2.52%.

The stock shows decent volume bars on the chart. However, the current price data of The Procter & Gamble Company (PG) stock is giving mixed signals, indicating that the market is uncertain about the stock’s direction. PG has not delivered notable returns to its investors year to date.
The Procter & Gamble Company (PG) Stock Price Technical Analysis
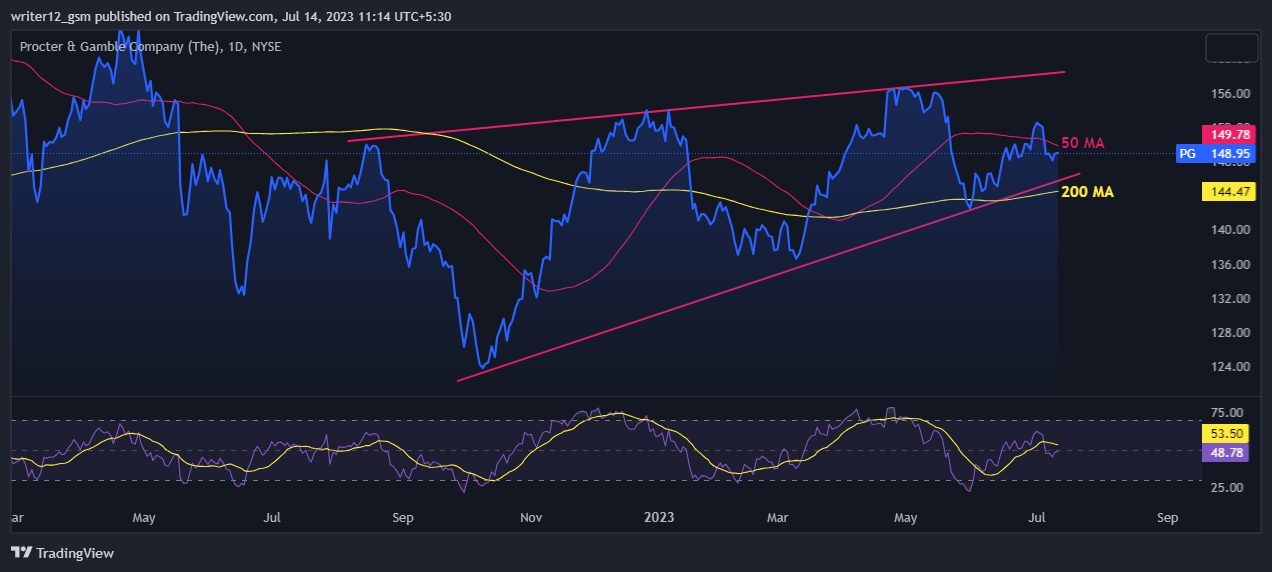
On the daily time frame, the price of The Procter & Gamble Company is stuck between the 50-day and 200-day moving averages. However, the price is consolidating, and 50-day and 200-day MA lines are range-bound, not giving any clear signals. Presently, the price is giving signals of indecision.
The MACD indicator is giving bearish signals as the signal line crosses below the MACD line. The MACD line at 0.1915 and the signal line at 0.3284 are above the zero line, indicating that the MACD is moving toward negative territory.
The RSI value is 48.78 points, near the middle of the range. The 14 SMA line is currently above the median line, around 53.50 points. However, the 14 SMA line is sloping downward, suggesting a loss of momentum. Presently, the market sentiment is turning bearish.
Trendline Analysis:
The price has respected its trendline support and resistance following a falling wedge pattern. The price will return to the current support If it gets rejected by the resistance. However, If the price breaks the resistance line, it will move in an upward direction to the next resistance.
Conclusion
The Procter & Gamble Company (PG) stock is trading in a narrow-range rising wedge pattern, indicating uncertainty in the market. The technical chart looks weak and the price is stuck in a range. Strategy for traders and investors are better off waiting for a clear break below or above the range before taking any action. The Procter & Gamble Company’s stock price is giving mixed signals at the moment.
Technical Levels:
- Support – The current support level for the share is $146.80
- Resistance –The current resistance level for the share is $152.52.
Disclaimer
The research given in this article is for informative and educational use only. Do not take this information as a financial or trading recommendation. Trading and investing have financial risks. Before creating any investment or trading decision, please consider your risk profile and circumstances.

Andrew is a blockchain developer who developed his interest in cryptocurrencies while pursuing his post-graduation major in blockchain development. He is a keen observer of details and shares his passion for writing, along with coding. His backend knowledge about blockchain helps him give a unique perspective to his writing skills, and a reliable craft at explaining the concepts such as blockchain programming, languages and token minting. He also frequently shares technical details and performance indicators of ICOs and IDOs.


