
 Home
Home News
News
- 1 Walt Disney Company Stock (DIS) is currently trading at $90.47 with a minor incline of 0.35% in the last 24 hours at the time of writing.
- 2 The Walt Disney Company Stock 52-week range is $84.07-$0.81.
- 3 The (DIS) market capitalization is $165.316 Billion.
The Walt Disney Company stock (DIS) is testing its critical support level in both weekly and daily time frames. However, the stock is forming a descending triangle pattern on the daily chart, which usually leads to a breakdown.
Moreover, DIS has been trading below the 50 and 200 moving averages in both weekly and daily time frames for a long time. This indicates a bearish trend for the stock. Investors should be patient and wait for a clear signal before making any moves.
By analyzing the price data of the (DIS) stock, it is clear that it is in a downtrend. The price rose by 2.03% in the last seven days. However, It gave a negative return of -1.79% in the last 1 year. Walt Disney Company stock is performing poorly. The stock price action signals bearishness.
Walt Disney Company Stock (DIS) Technical Analysis
The Walt Disney Company stock (DIS) is trading below the 50 and 200 EMAs, indicating a bearish trend. The price may decline further next week if the selling pressure persists. The bulls are not able to take control of the market at the moment. A bearish crossover has occurred on the chart.
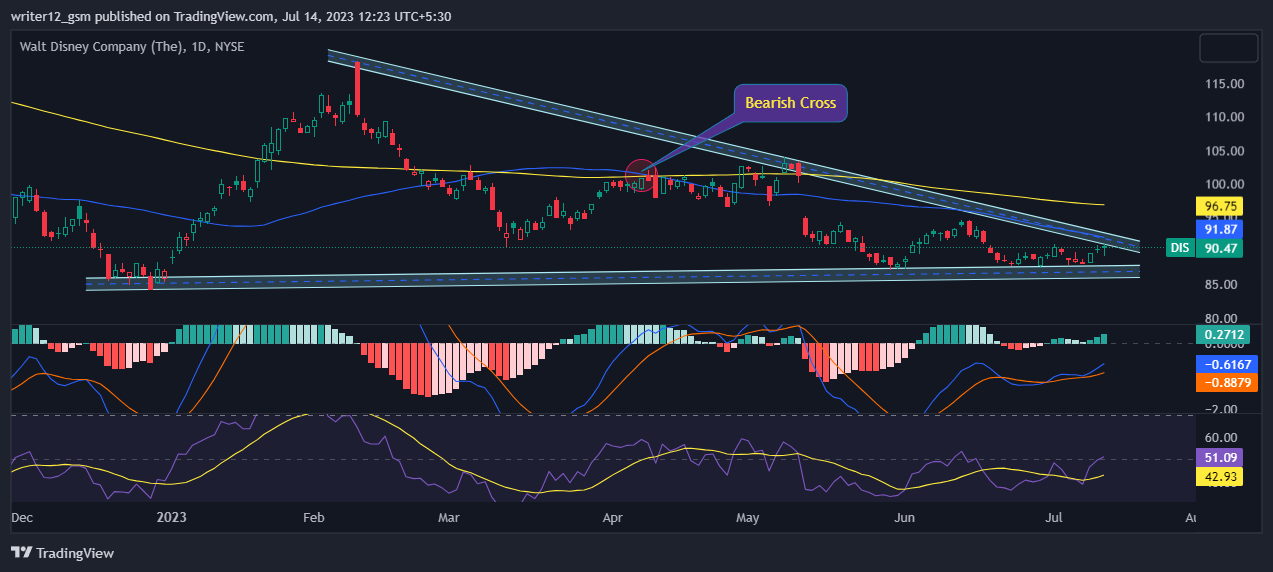
The MACD indicator is also negative. The MACD line at -0.6167 and the signal line at -0.8879 are below the zero line, implying that the MACD is bearish.
The RSI value is 51.09 points, near the middle of the range. The 14 SMA line is currently below the median line, around 42.93 points, which shows a neutral market sentiment for now.
Volume Analysis: Walt Disney Company stock (DIS)’s average trading volume for the last three months is 13.16 Million and the average volume for the last 10 days is 12.46 Million.
Summary
The Walt Disney Company stock (DIS) is in a downtrend. The price may drop further if it breaches the closest support level. The key indicators such as EMA, RSI, and MACD are giving bearish signs for the stock. Negative signals from the indicators are scaring investors. The best strategy for traders and investors is to wait for a clear break below or above the range before taking any action and avoid the fear of missing out to minimize losses.
Technical Levels:
- Support – The current support level is $84.23.
- Resistance –The current resistance level is $94.64.
Disclaimer
The analysis given in this article is for informational and educational use only. Do not take this information as financial or trading advice. Trading and investing contain financial risk. Before making any investment or trading decision, please consider your risk profile and circumstances.
Mr. Pratik chadhokar is an Indian Forex, Cryptocurrencies and Financial Market Advisor and analyst with a background in IT and Financial market Strategist. He specialises in market strategies and technical analysis and has spent over a year as a financial markets contributor and observer. He possesses strong technical analytical skills and is well known for his entertaining and informative analysis of the Financial markets.


