
 Home
Home News
News

- 1 AT&T Stock Price (NYSE:T) fell 7% in the current week and hit a 52 week low.
- 2 T Stock Price faced rejection from the 50 day EMA.
- 3 AT&T Stock Price below the 50 day and 200 day EMA showcase downtrend.
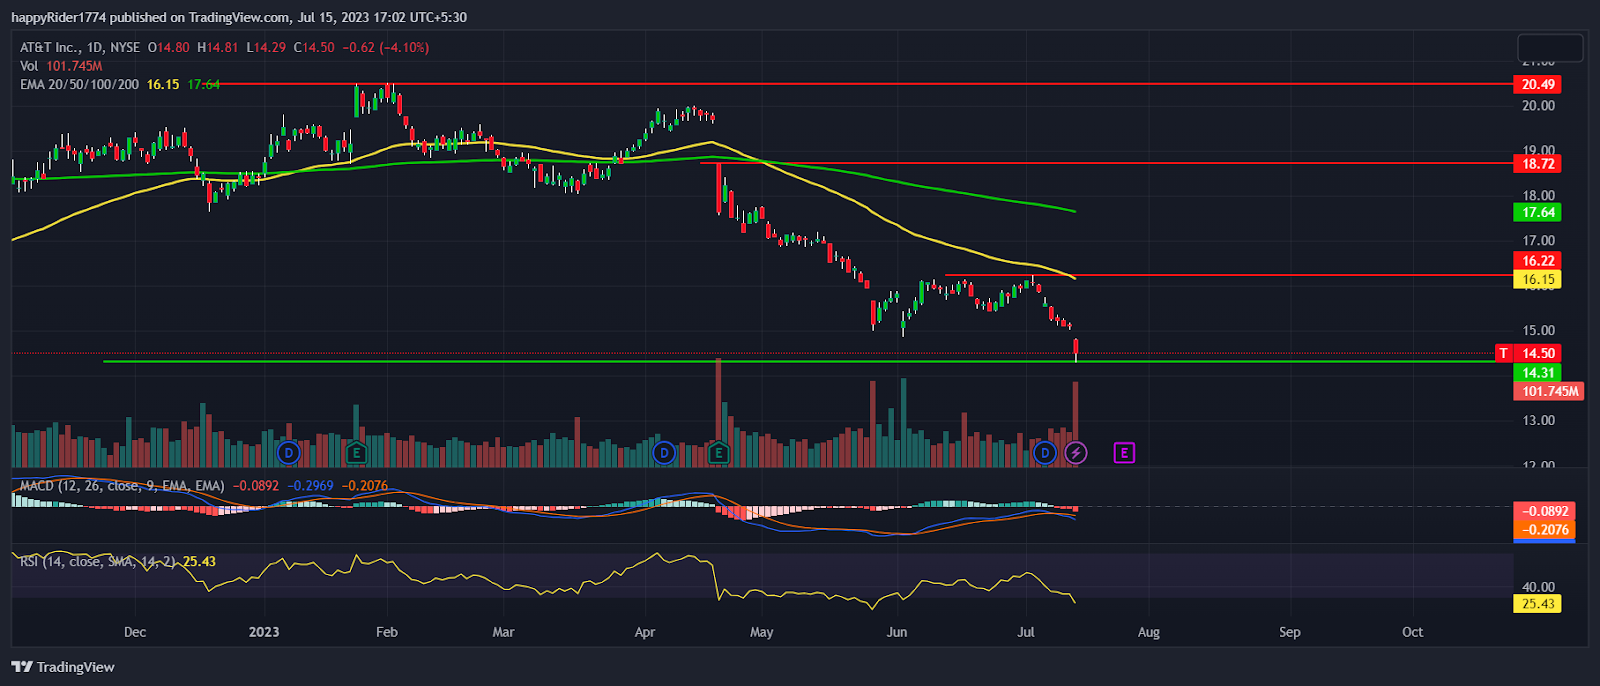
AT&T Stock Price (NYSE: T) fell 7% in the current week and hit a 52 week low. T Stock Price faced resistance at $16.00 and declined by forming lower lows.

The selling volume also surged and prices fell with strong momentum indicating some big investors might have taken exit.

T Stock Price is trading below the 50 day EMA and the 200 day EMA showcase downtrend. Recently, buyers attempted to climb above the 50 day EMA to reverse the trend but it got rejected and prices reverted down.
In the mid of April, AT&T Stock fell 10% after the release of quarterly earnings. It disturbs the sentiment of investors. Slowly and steady prices declined and entered into the correction phase.
The downfall in the AT&T Stock halted near $15.00 and buyers tried to rebound. T Stock consolidated in a narrow range between $15.00 to $16.00 and showed signs of base formation. But recent downfall broke down the lower range which invited further decline.
AT&T Stock closed the previous session at $14.50 with an intraday decline of -4.10%. The market capitalization stands at $103.66 Billion.
Will AT&T Stock bounce back soon?
AT&T Stock Price has not performed well and disappointed the expectation of the long term investors.
Presently, the price is at the crucial support and buyers might try to give a short term bounce. The reliability of the pull back will remain doubtful till price is trading below $16.00 level.
AT&T Stock has corrected a lot and seems oversold so minor pull back is possible. However, the price is expected to consolidate for some time before deciding the further direction.
On the other hand, if the T Stock price drops below $14.00 then it will open more down side and may give pain to investors. The technical analysis suggests, T stock price is in bear grip and probability of bounce is low.
T Stock Price is bearish on multiple time frame
T Stock Price is bearish on multiple time frames. The buyers seem reluctant to build long positions due to the fear of more downside. The broader market is on rise and if it continues the momentum then it might positively impact the AT&T Stock.
The MACD generated a negative crossover and histogram bar is in decline indicates bearishness. The RSI at 25 donotes weakness but it is near to the oversold territory and a relief rally may trigger anytime.
Conclusion
AT&T Stock Price (NYSE: T) fell 7% in the current week and is trading near to the 52 week low. The technical analysis suggests, T Stock Price is in downtrend and possibility of bounce is low.
Technical levels
Resistance levels: $16.00 and $17.00
Support levels: $14.00 and $13.00
Disclaimer
The views and opinions stated by the author, or any people named in this article, are for informational purposes only. They do not establish financial, investment, or other advice. Investing in or trading crypto assets comes with a risk of financial loss.

Andrew is a blockchain developer who developed his interest in cryptocurrencies while pursuing his post-graduation major in blockchain development. He is a keen observer of details and shares his passion for writing, along with coding. His backend knowledge about blockchain helps him give a unique perspective to his writing skills, and a reliable craft at explaining the concepts such as blockchain programming, languages and token minting. He also frequently shares technical details and performance indicators of ICOs and IDOs.


