
 Home
Home News
News
- 1 General Electric price increased by 2.93% over the past seven days.
- 2 General Electric ( NYSE: GE ) stock’s 52-week price range is $46 – $111.
General Electric has been increasing its earnings by 51% every year on average, according to Simplywall, a financial website that provides analysis and insights on stocks. This is higher than the average annual growth of 36.8% in the Industrials industry. However, its revenues have been shrinking by 9.4% per year on average. General Electric has a return on equity of 25.5% and a net margin of 10.2%.
Moreover, General Electric has a debt-to-equity ratio of 68.3%, which is calculated by dividing its $22.4 Billion debt by its $32.8 Billion equity Simplywall data shows. General Electric also has $164.5 Billion in assets and $131.6 Billion in liabilities. Its interest coverage ratio is 6.3, which is derived from dividing its $5.9 Billion in earnings before interest and taxes by its interest expenses. Additionally, it has $22.4 Billion in cash and short-term investments.

The market capitalization of GE stock is $120.091 Billion and the total revenue is $76.57 Billion. Moreover, the stock’s basic EPS is $7.52 and the price-to-earnings ratio is 14.93. Moreover, the average volume is 4.81 Million and the current volume is 2.718 Million, the current volume is below average volume.
Moreover, this month, the stock performed well as it was up by 3.34% and up by 39.98% over the last six months. Moreover, General Electric (NYSE: GE) stock’s year-to-date return is positive with an increase of 68.14% and its overall 1-year return is positive with an increase of 131.68%.
General Electric Price, Technical Analysis in 1-D Timeframe
The price action shows that the General Electric stock ( NYSE: GE ) started its journey by rallying upwards from the major demand zone at $139.60 and made higher highs and higher lows, reaching an all-time high of $461.55 in seven months.
However, the price also took some pullbacks for correction and rested on the trendline, which acted as a support and helped the price bounce back. The price is above all the major EMAs and the volume is up significantly, as seen on the volume graph.
To continue surging ahead, the stock needs more volume. The price action shows that the General Electric ( NYSE: GE ) stock was in a downtrend last year, but GE price bounced back from the major demand zone at $47.80 with a double bottom pattern. GE price rose by 134% in nine months, reaching a high of $111.
Moreover, the stock did not face much resistance in its journey, as it traded at a 45-degree angle, indicating strong buying sentiment. At the time of publishing, GE price is $110.28 and still bullish, as it is above all major EMAs. GE price may hit the first target of $115 followed by $125. Therefore, the stock shows bullishness in the one-day time frame.
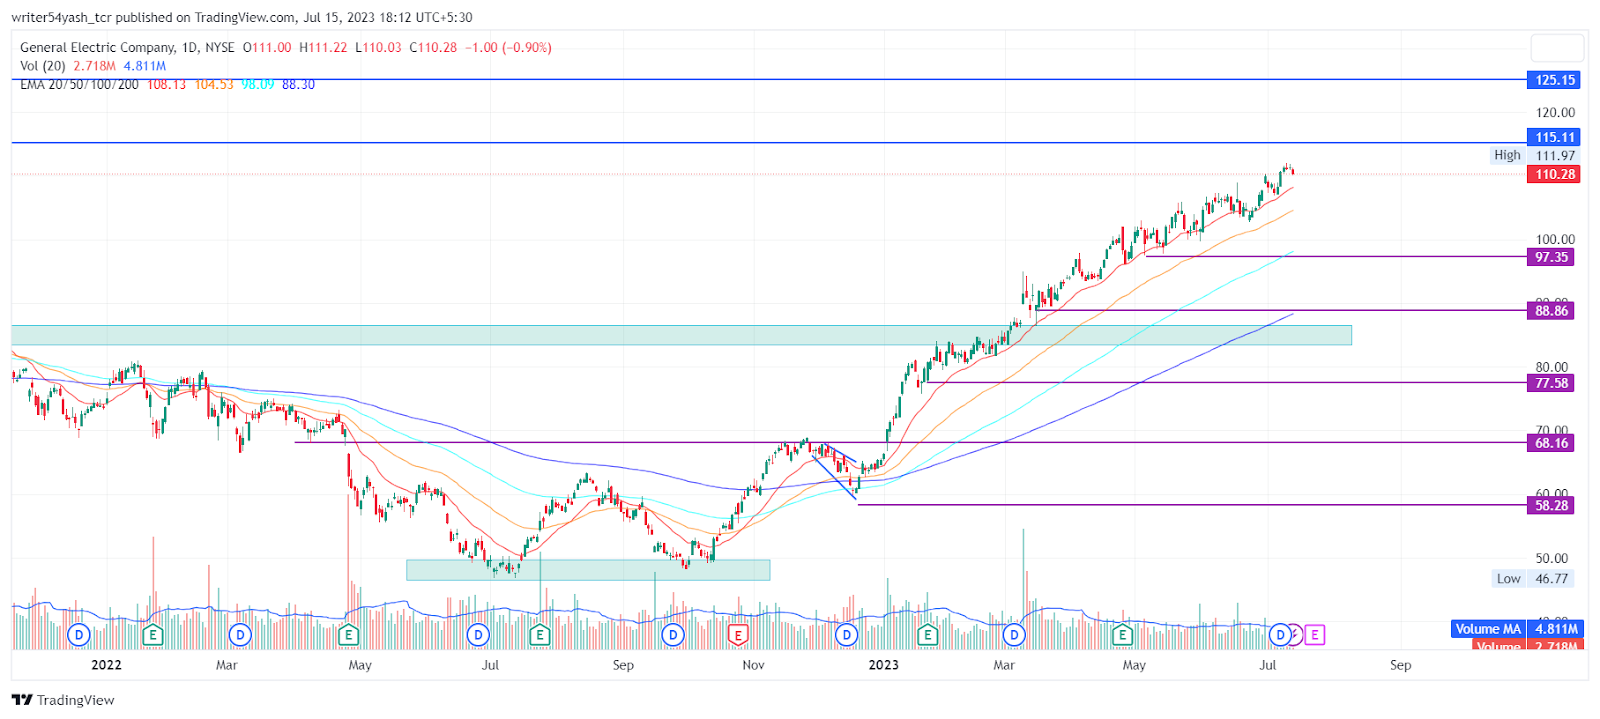
At the time of publishing, General Electric stock ( NYSE: GE ) is trading above the 20, 50, 100, and 200-day EMAs (exponential moving average), which is supporting the price trend. Hence, the GE Price is expected to move upwards giving bullish views over the daily time frame chart.
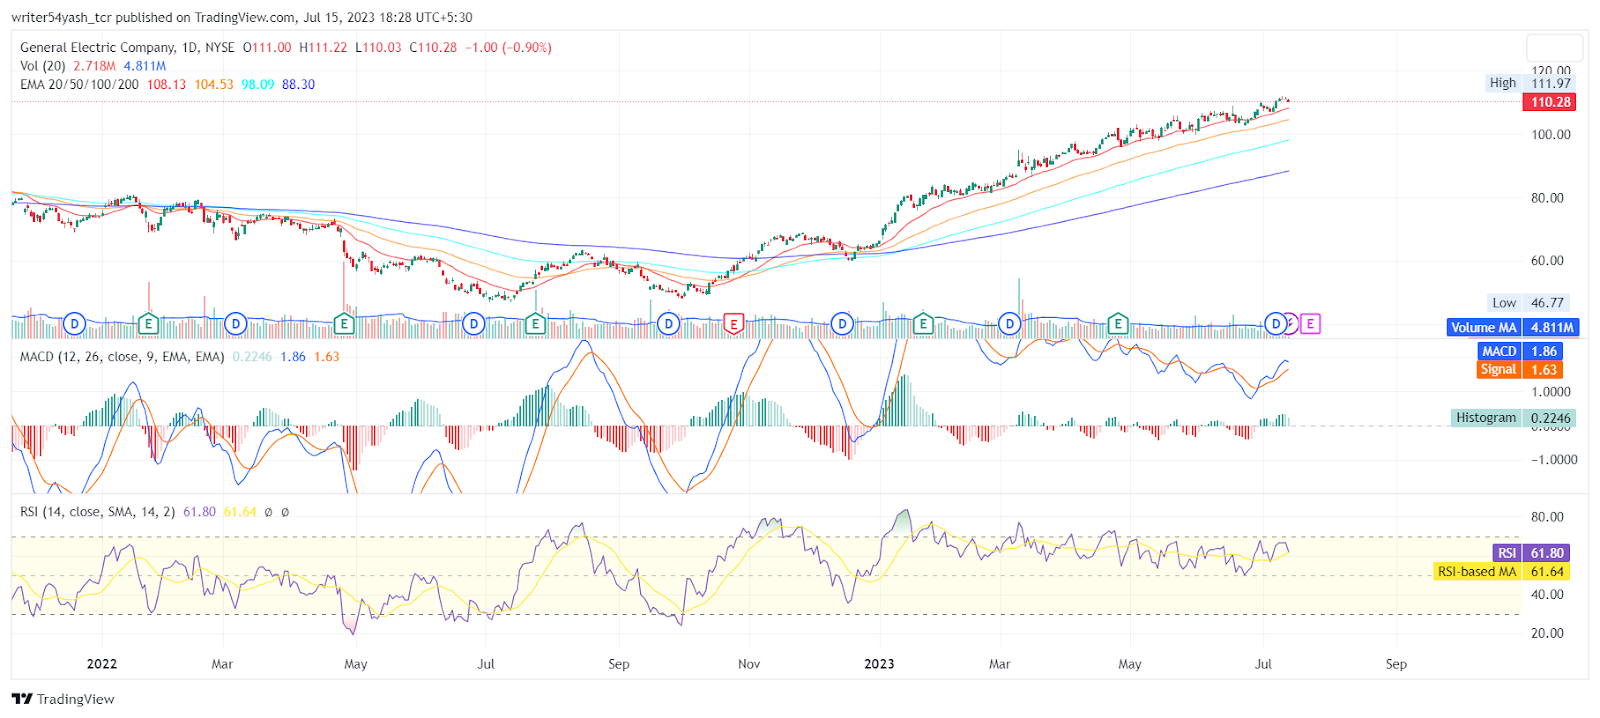
The current value of RSI is 61.80 points. The 14 SMA is above the median line at 61.64 points which indicates that the price is bullish as the RSI is in bullish territory.
The MACD line at 1.86 and signal line at 1.63 are above the zero line and a bullish crossover was observed in the MACD oscillator which signals more bullishness for the GE stock price.
Summary
General Electric stock shows that the investors and traders of the stock are bullish on the 1D time frame. The price action shows a bullish outlook at the time of publishing. The technical parameters of the GE stock price also support the bullish trend. The major indicators MACD, RSI, and EMA are giving positive signals and imply that the uptrend may continue.
Technical Levels:
- The nearest support: $97.35 and $88.86.
- The nearest resistance: $115.11 and $125.15.
Disclaimer
In this article, the views and opinions stated by the author, or any people named are for informational purposes only, and they don’t establish the investment, financial, or any other advice. Trading or investing in cryptocurrency assets comes with a risk of financial loss.

Nancy J. Allen is a crypto enthusiast, with a major in macroeconomics and minor in business statistics. She believes that cryptocurrencies inspire people to be their own banks, and step aside from traditional monetary exchange systems. She is also intrigued by blockchain technology and its functioning. She frequently researches, and posts content on the top altcoins, their theoretical working principles and technical price predictions.


