
 Home
Home News
News
- 1 Netflix Inc. stock is currently trading at $441.91 with a drop of -1.88% in the last 24 hours.
- 2 The Netflix Inc. 52-week price range is between $188.40 – $456.48.
- 3 The Netflix Inc. stock market capitalization is $196.447 Billion.
Netflix’s stock price rebounded from its lows and formed higher high patterns due to strong fundamentals and technicals. The current price data of Netflix Inc. (NFLX) stock indicates that it is in an uptrend. Moreover, Netflix Inc. performed well in the last few weeks. It reached a high of $456.48 from its lowest price. The average trading volume of Netflix Inc. for the last 3 months is 6.91 Million and for the past 10 days is 5.49 Million.
The price has followed its trendline support. The price is moving toward the supply zone. If the price breaks the resistance line, it will continue to rise to the next resistance level. However, if the price faces rejection at the resistance, it will fall back to the current support.

The stock delivered an outstanding return of 150% in a span of 1 year for its investors. The market sentiment is positive about the stock because of its strong technicals. Furthermore, a good volume is present in Netflix Inc. the Bulls are attracted to the stock because of its good performance in recent days. Nevertheless, investors should be cautious and watch the price action closely as the market can be volatile and unpredictable.
Netflix Stock Price Technical Analysis
The Netflix stock price is above the 50-day and 200-day MAs, which suggests that the price is in an uptrend. There is a possibility that the stock’s worth will increase even further in the forthcoming week if the buyers persist. A golden cross between the 50-day and 200-day MAs is indicating the uptrend.
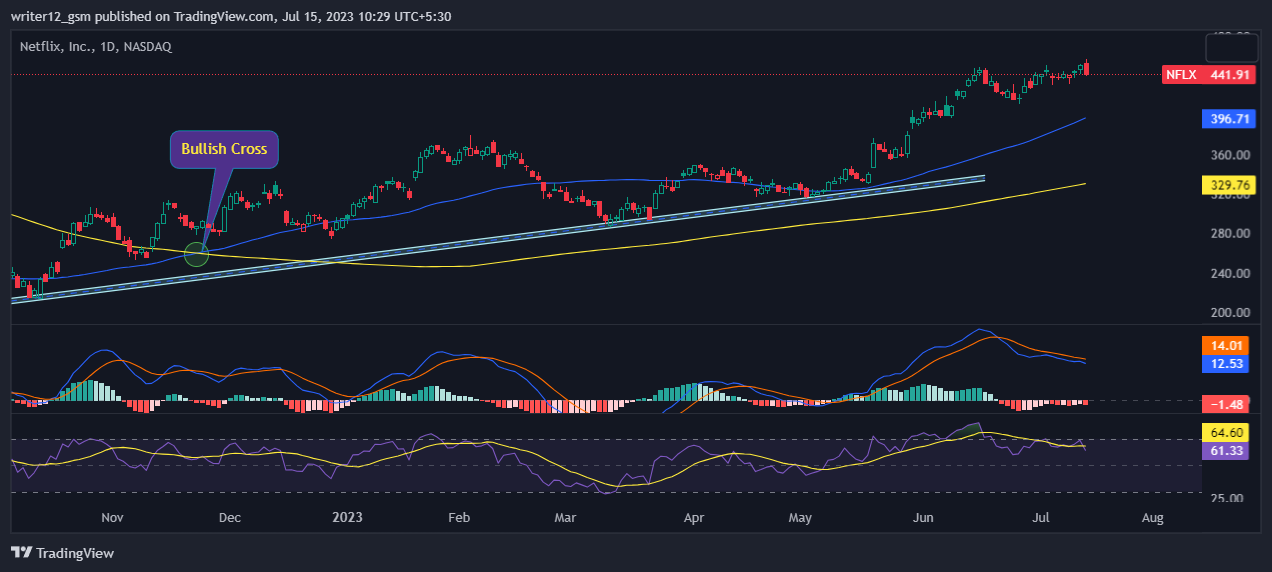
The RSI is currently at 61.33 points. The 14 SMA line is above the median line, around 64.60 points. The 14-Day SMA line is also above the median line and it is rising. The market shows bullish sentiments.
The MACD indicator is giving positive signals. The MACD line at 12.53 and the signal line at 14.01 are above the zero line, indicating that the MACD is in the bullish zone.
Conclusion
Netflix stock forecast is bullish as of now as it is rising steadily, making the higher-highs structure. The technical chart looks promising and suggests a profitable outlook. The price action implies that the price could rise further in the near future if it surpasses its main trendline resistance slightly. Netflix Inc.’s stock price presents a positive scenario at the moment. Major reliable indicators such as EMA, RSI, and MACD confirm the bullish signals for Netflix stock. If the buyers maintain their support for the stock, then it will easily reach the level of $460.
Technical Levels:
- Support – The current support level is $428.
- Resistance –The current resistance level is $460.
Disclaimer
The analysis given in this article is for informational and educational use only. Do not take this information as financial or trading advice. Trading and investing contain financial risk. Before making any investment or trading decision, please consider your risk profile and circumstances.

Adarsh Singh is a true connoisseur of Defi and Blockchain technologies, who left his job at a “Big 4” multinational finance firm to pursue crypto and NFT trading full-time. He has a strong background in finance, with MBA from a prestigious B-school. He delves deep into these innovative fields, unraveling their intricacies. Uncovering hidden gems, be it coins, tokens or NFTs, is his expertise. NFTs drive deep interest for him, and his creative analysis of NFTs opens up engaging narratives. He strives to bring decentralized digital assets accessible to the masses.


