
 Home
Home News
News
- 1 Zcash price prediction showcases the decline of ZEC crypto inside an interesting pattern over the daily time frame chart.
- 2 ZEC crypto is trying to escape the 20 and 50-EMAs to surge towards the 100 and 200-days Daily Moving Average.
- 3 The pair of ZEC/BTC was at 0.001027 BTC with an intraday drop of 2.43%.
Zcash price prediction suggests the struggle of ZEC crypto inside an ascending triangle pattern over the daily time frame chart. However, sellers are pulling ZEC crypto prices towards the lower trendline of the ascending triangle pattern. Now, buyers need to come forward to save Zcash crypto from falling significantly. Investors in Zcash cryptocurrency need to wait for any directional change over the charts.

Zcash price was at $31.08 and lost around 1.02% of its market capitalization during intraday. Trading volume decreased by 40.17% intraday. This demonstrates that sellers are trying to pull ZEC crypto towards the lower trendline of the ascending triangle pattern. Volume to market cap ratio was at 0.0321.

Zcash Price Prediction: Technical Analysis
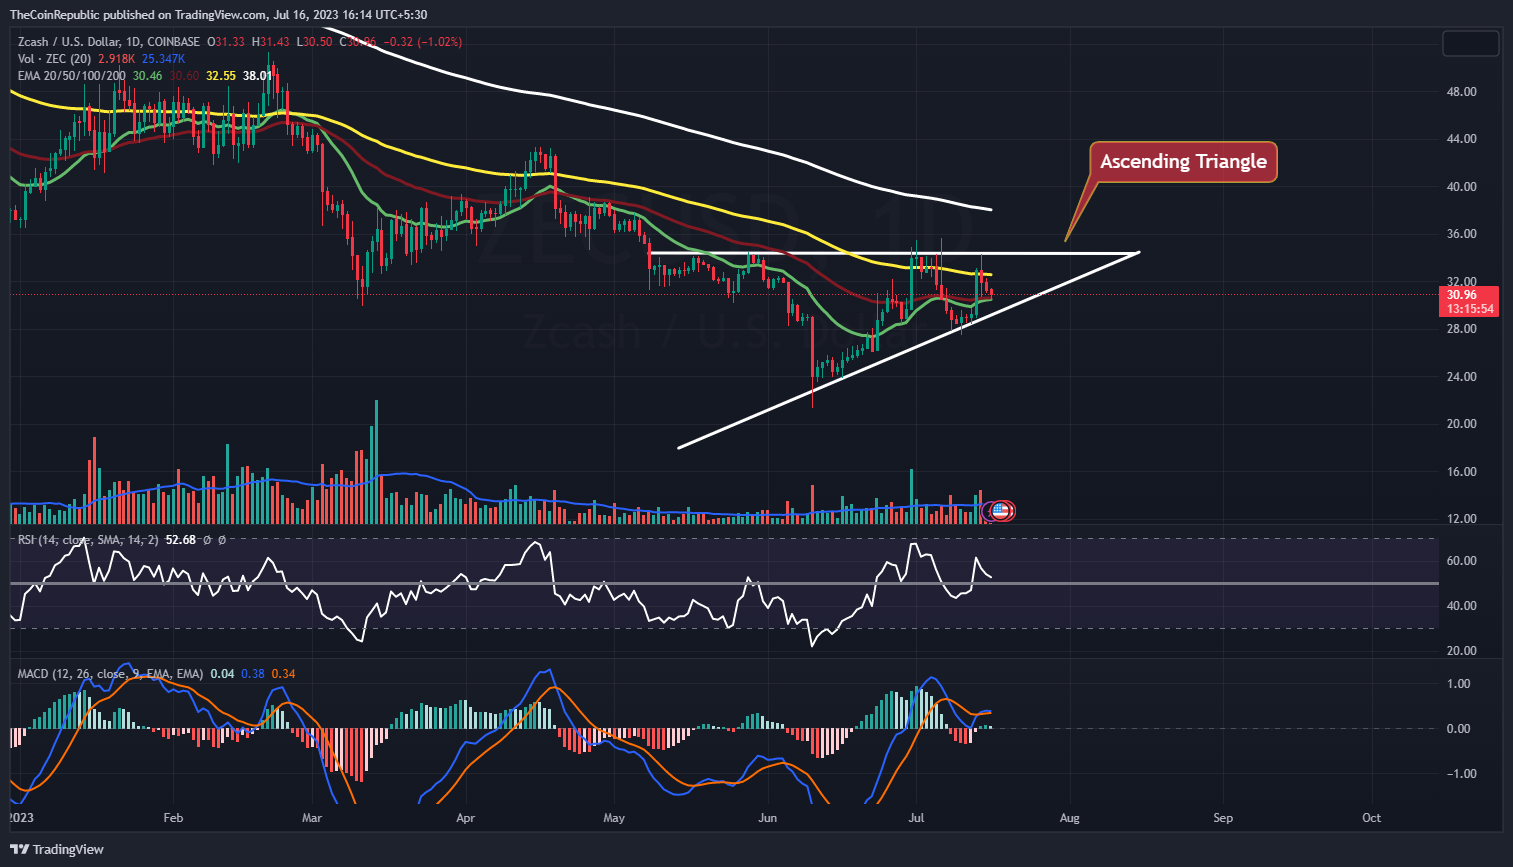
Zcash price prediction showcases the declining momentum of ZEC crypto inside an interesting pattern over the daily time frame chart. However, buyers need to come forward to save ZEC crypto from falling below the ascending triangle pattern. Meanwhile, Zcash price tried to break out from the ascending triangle pattern but couldn’t sustain at the neckline and slipped.
Zcash price needs to attract more buyers during the day’s trading session to bounce back towards the neckline. Meanwhile, ZEC crypto surging towards the 100 and 200-days Daily Moving Average.
Zcash crypto price has gained 7.92% in a week and 25.53% in a month. Nevertheless, ZEC crypto prices dropped around 27.21% in the last three months and by 26.82% in the last six months. Moreover, ZEC slumped by around 16.54% year to date and 46.74% in a year.
Technical indicators Zcash cryptocurrency is in a downtrend. Relative strength index showcases the downside trend of ZEC crypto price. RSI was at 52 and is heading towards from neutrality to oversold.
MACD exhibits the consolidation phase of Zcash price inside the ascending triangle pattern. The MACD line is overlapping the signal line waiting for any directional change. Investors in Zcash cryptocurrency need to wait for any directional change over the daily time frame chart.
Summary
Zcash price prediction indicates that ZEC cryptocurrency is struggling within an ascending triangle pattern on the chart of the daily time frame. To prevent ZEC cryptocurrency from slipping below the ascending triangle pattern, purchasers must step up. The price of Zcash increased by 7.92% in one week and by 25.53% in one month. In addition, ZEC fell by roughly 16.54% this year and 46.74% over the past 12 months. Technical indications suggest Zcash is in a downtrend. Investors in Zcash must watch the daily time frame chart for any directional changes.
Technical Levels
Support Levels: $30.00 and $29.29
Resistance Levels: $33.00 and $35.00
Disclaimer
The views and opinions stated by the author, or any people named in this article, are for informational purposes only, and they do not establish financial, investment, or other advice. Investing in or trading crypto or stock comes with a risk of financial loss.

Nancy J. Allen is a crypto enthusiast, with a major in macroeconomics and minor in business statistics. She believes that cryptocurrencies inspire people to be their own banks, and step aside from traditional monetary exchange systems. She is also intrigued by blockchain technology and its functioning. She frequently researches, and posts content on the top altcoins, their theoretical working principles and technical price predictions.


