
 Home
Home News
News

- 1 Decentraland price trades at 0.4070 while witnessing a loss of -2.47% during the intraday session.
- 2 The market capitalization has dropped by 0.79% to $772,640,590 at the time of writing.
- 3 The year-to-date return of decentraland is 37.90% while the three-month return is -40.35%.
MANA price has been in an uptrend since the middle of June, forming higher highs and higher lows, rising from the support level of $0.33. The cryptocurrency’s price faced several hurdles and retracement but has recovered more than half of the losses it incurred during the start of June.
The start of June was rough for the crypto industry, which negatively affected the market leaders Bitcoin and Ethereum as well as the altcoins. MANA suffered a loss of roughly 42% during that phase. Recently, the price faced rejection from $44.50 and is currently correcting the bullish move.

It has entered into a narrow consolidation zone in a smaller time frame above the support level of $0.4050. The current consolidation range is $0.4050 and $0.4200. If bears can push the price below $0.4050, it might head toward the next support level of $0.37.
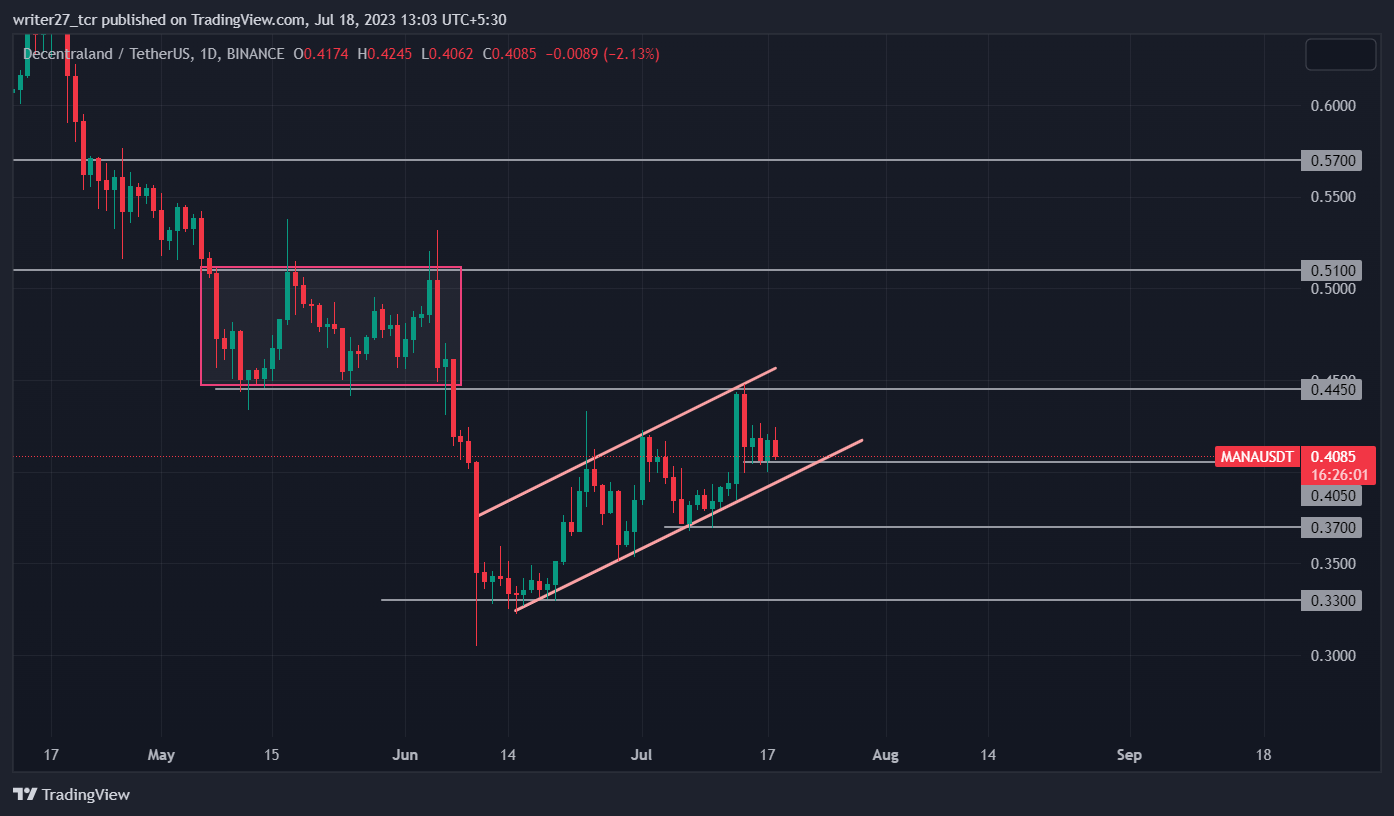
Source: MANA/USDT Chart By TradingView.
The previous candle closed as a bullish candle and the current candle is headed toward low of previous candle in hopes of breaking it. Traders should wait for the candle to close below $0.4050 as the price has been in a strong bullish momentum since the past month.
If bulls can push the price above $0.42, it might then target the $0.4450 level and potentially shatter this to rise further toward the next resistance level of $0.51. The concern is regarding the psychological level of $0.50 which might act as a hurdle for the price. The 24-hour volume of Decentraland has increased by 29.17%. The price is down by -92.99% from the all-time high of $5.90.
Will MANA Price Melt To $0.37?
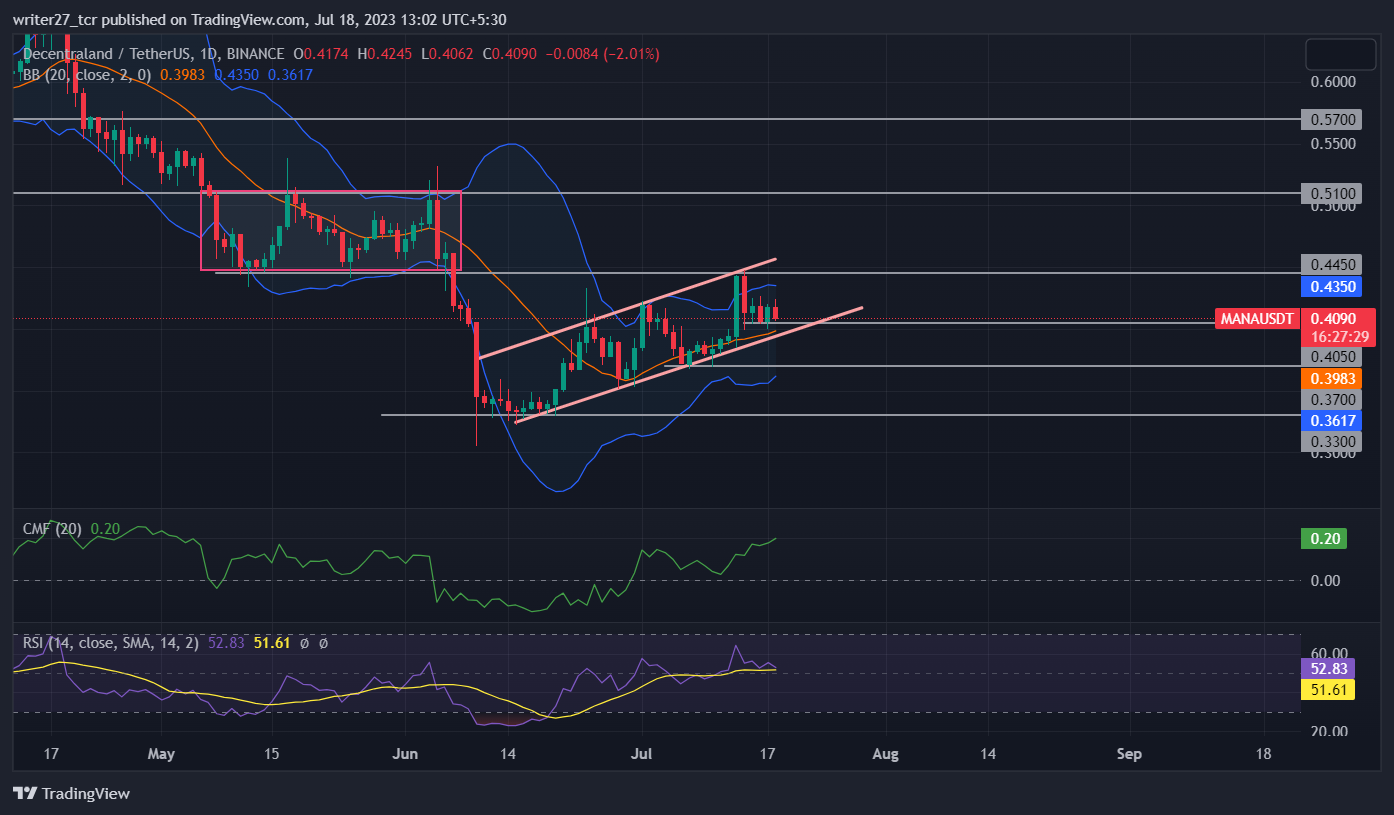
The cryptocurrency’s price has crossed below the 50-day EMA after rejecting the 100-day EMA, suggesting that there is increased involvement of bears in the market. Chaikin money flow score is 0.20, implying that price is in a bullish momentum and possesses strength.
Relative strength index (RSI) has dipped below the 60 mark and currently trades at 53.09, denoting that the cryptocurrency’s price is in neutral territory, facing equal pressure from bulls and bears.
The price crossed above the upper band of bollinger and started to decline. The bands of bollinger have also contracted, hinting at less volatility in the market. The long/short ratio is 0.91, with 47.83% longs and 52.17% shorts, showing that bearish pressure hovers over the price in the last 24 hours.
Conclusion
The market structure and price action of Decentraland shows that price is in an indecisive phase as it has been consolidating since the past three days. Technical parameters as of now are favoring the selling side but the overall trend still appears to be bullish.
Technical levels
Major support: $0.37 and $0.33
Major resistance: $0.4450 and $0.51
Disclaimer
The views and opinions stated by the author, or any people named in this article, are for informational purposes only. They do not establish financial, investment, or other advice. Investing in or trading crypto assets comes with a risk of financial loss.

Andrew is a blockchain developer who developed his interest in cryptocurrencies while pursuing his post-graduation major in blockchain development. He is a keen observer of details and shares his passion for writing, along with coding. His backend knowledge about blockchain helps him give a unique perspective to his writing skills, and a reliable craft at explaining the concepts such as blockchain programming, languages and token minting. He also frequently shares technical details and performance indicators of ICOs and IDOs.


