
 Home
Home News
News
- 1 The NVIDIA Corporation. (NVDA) stock price is trading at $464.61 currently with a market capitalization of $1.148 Trillion.
- 2 NVDA stock gave more than 200% return to investors in a year.
Nvidia (NASDAQ: NVDA) gained 3% in July, beating the Nasdaq Index, and has soared 200% this year, hitting a market cap of over $1 Trillion. Nvidia is the first chip making company to reach the $1 Trillion mark. The primary reason for this rise of NVDA stock is artificial intelligence.
NVIDIA Corporation has been hitting higher highs and keeping its momentum. NVDA climbed to the $480.88 level from the low price of $108.13 in 52 weeks. Its average volume for the past 3 months is 47.89 million.

NVIDIA Corporation’s stock price has shown bullish behavior on the daily time frame, displaying extremely bullish signals. The price has been rising higher and is above the 50- and 200-day moving averages
Weekly Analysis of NVDA Stock
In the weekly time frame, NVIDIA Corporation’s stock price has broken above the 50 and 200-day moving averages, signalling the strength of the bulls. NVDA stock price has shown that the market has bullish expectations. Furthermore, RSI and MACD are also positive on the weekly time frame.
NVDA Stock Price Technical Analysis
The price of NVIDIA Corporation. (NVDA) has risen above the 200-day and 50-day moving averages indicating the dominance of the buyers in the market. However, if the buyers maintain the pressure, NVDA stock price could rise further and enter an uptrend. Moreover, the bullish cross confirms the bullish trend on a daily time frame.
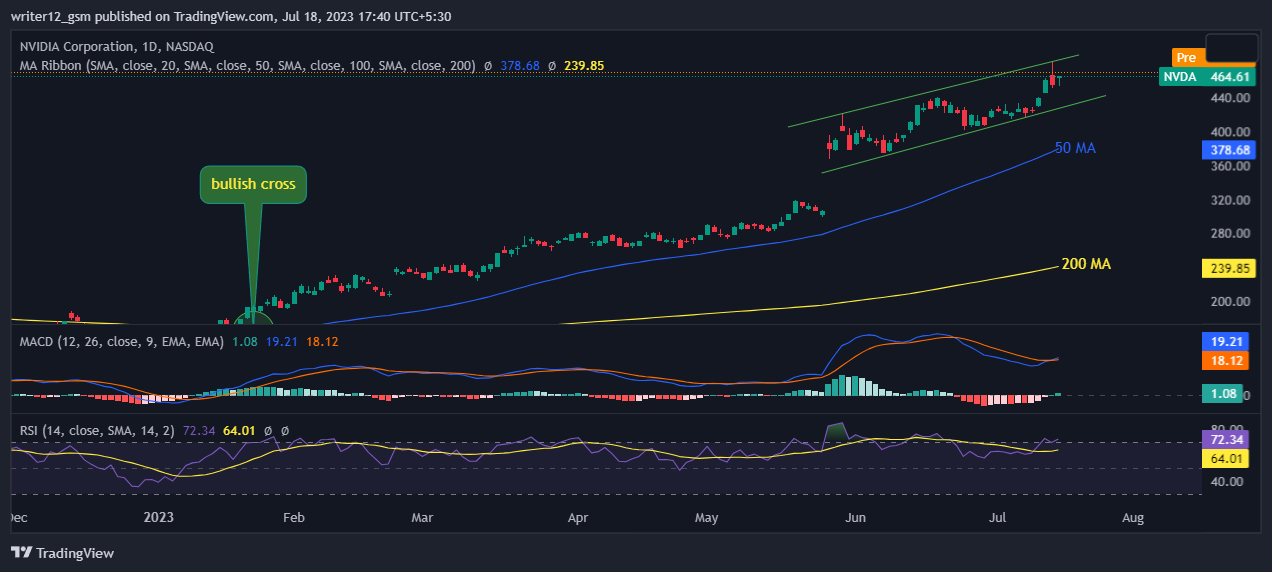
The RSI has been trading in an overbought zone. The RSI line is around 72.34. The 14 SMA line has a value of 64.01 points which implies that NVIDIA Corporation’s price is in the bullish area and is extremely positive.
Currently, MACD is giving bullish signals. The MACD line at 19.21 and the signal line at 18.12 is above the zero line, indicating that the MACD is in positive territory and is giving positive signals as of now.
The Bollinger Bands for NVDA’s stock show a current upper band value of $459.38, a middle line value of $428.63, and a lower line value of $397.88. The stock’s price is trading above the upper line indicating a bullish trend.
Conclusion
NVIDIA Corporation’s performance and momentum has been impressive. The share is hitting higher highs and overtaking the 50- and 200-day moving averages on both daily and weekly time frames. The price, RSI, and MACD are all positive, signalling a strong uptrend and a favorable outlook. Moreover, the stock is already high, so investors should be cautious and invest wisely.
Technical Levels:
- Support – The current support level is $450.76.
- Resistance –The current resistance level is $500.
Disclaimer
The NVDA stock price prediction given in this article is for informational and educational use only. Do not use this information as financial, investment, or as trading advice. Investing and trading in stock is a risky task. Please consider your circumstances and risk profile before making any investment decisions.

Nancy J. Allen is a crypto enthusiast, with a major in macroeconomics and minor in business statistics. She believes that cryptocurrencies inspire people to be their own banks, and step aside from traditional monetary exchange systems. She is also intrigued by blockchain technology and its functioning. She frequently researches, and posts content on the top altcoins, their theoretical working principles and technical price predictions.


