
 Home
Home News
News
- 1 SBAC stock is heading into the selling zone and slips below the 20 days EMA.
- 2 Bulls lose the battle, resulting in price correction.
SBA Communications Corporation stock (SBAC) price showed a breakdown and bearishness on the chart. Moreover, a death crossover indicated a massive correction and noted a bearish engulfing candlestick in the last trading session. The price action shows that SBAC stock broke the lower trendline and is heading towards the round mark of $200 to retest, which was the strong demand zone.
Furthermore, the chart structure stayed in a downtrend, where lower highs and lower lows persisted to form and stock retesting new lows from the past sessions. SBAC was corrected by more than 25% in the past two months and faced rejection near the 50-day EMA multiple times.

Recently, the stock found support near $210 and rebounded from there. However, the stock did not exceed the 100 days EMA, and sellers showed their presence and were forced below the 20 days EMA to retest the base.
In the last session, SBAC stock, among its sectoral stocks, noted selling pressure and fell over the top. Moreover, the stock faced headwinds in the past months because of the weak growth estimates and underweight rating.
SBA Communications Corp. is a real estate investment trust which engages in the provision of wireless communications infrastructures. It operates through the following business segments: Domestic Site Leasing, International Site Leasing, and Site Development. The Domestic Site Leasing segment includes AT&T, Sprint, T-Mobile, and Verizon Wireless. The International Site Leasing segment acquires and develops towers. The Site Development segment is involved in consulting and construction activities.
At press time, SBAC stock was traded at $226.15, with an intraday drop of 7.23% among the top losers in yesterday’s session. Moreover, the trading volume increased massively by 35% to 2.253 Million, showing sellers’ short buildup activity. The market cap is $24.501 Billion.
Daily Charts Shows Breakdown
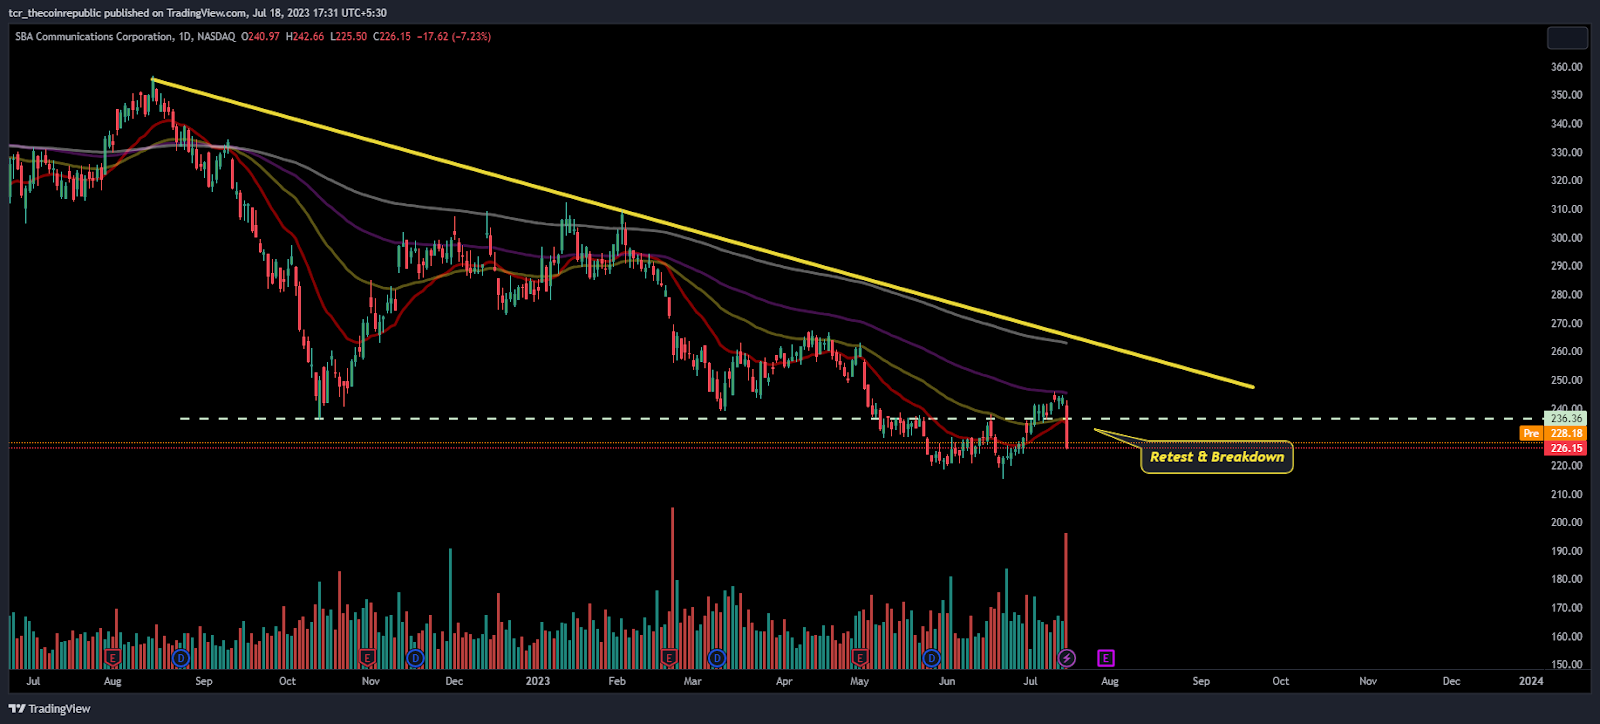
On the daily charts, SBAC stock price stayed in a downtrend and retested the 20-day EMA near $240 but could not sustain it and fell back below $230.
Furthermore, SBAC stock slipped below the 23.6% Fib level, showing a weak chart structure, and selling persisted from the past months.
Short Term Charts Show Seller Dominance
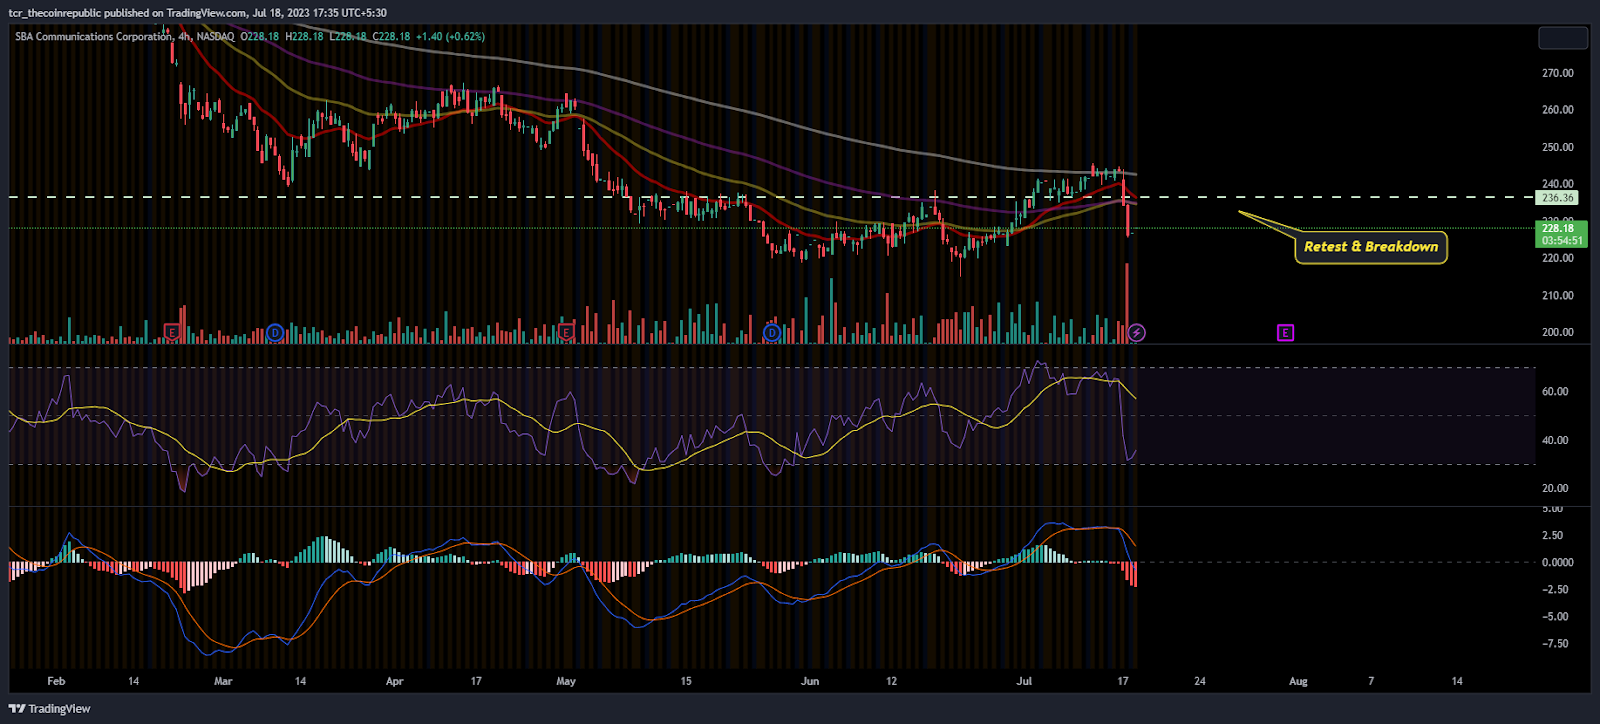
On the 4-hour charts, SBAC stock showed a breakdown of the rising wedge pattern and the leading indicators, suggesting a major fall from the neutral range. Furthermore, the buyers are cautious and unwinding their positions because they fear losing out.
The RSI curve showed a steep decline toward the oversold region, with a negative divergence indicating a volatile chart structure.
The MACD indicator showed a bearish crossover and massive red bars were noted on the histogram, suggesting bearishness on the charts.
Conclusion
SBA Communication Corporation stock (SBAC) price slipped below the key moving averages and noted a breakdown on the charts. Moreover, the chart structure signals a further downside and slippage in the upcoming session.
Technical Levels:
Support Levels: $200
Resistance Levels:$240 and $255
Disclaimer
The views and opinions stated by the author, or any people named in this article, are for informational purposes only and do not establish financial, investment, or other advice. Investing in or trading crypto assets comes with a risk of financial loss.

Adarsh Singh is a true connoisseur of Defi and Blockchain technologies, who left his job at a “Big 4” multinational finance firm to pursue crypto and NFT trading full-time. He has a strong background in finance, with MBA from a prestigious B-school. He delves deep into these innovative fields, unraveling their intricacies. Uncovering hidden gems, be it coins, tokens or NFTs, is his expertise. NFTs drive deep interest for him, and his creative analysis of NFTs opens up engaging narratives. He strives to bring decentralized digital assets accessible to the masses.


