
 Home
Home News
News
- 1 The price of VeChain (VET) is trading at around $0.01943461; it declined by -0.66% in the last 24 hours (press time).
- 2 VET price observed an increase of 3.90% in the last 7 days.
- 3 The market capitalization of VeChain is $1,411,155,975.
VeChain crypto is struggling to break the downtrend and faces two immediate obstacles: a trendline and the 200-day EMA. The crypto’s next move will hinge on whether it can surpass or drop below the pattern.
The outlook is unclear at the moment. However, the price increased by 3.90% last week, showing that VeChain performed well recently. VeChain lost -93.14% of its value in 2 years after making its all-time high of $0.280991.

The current market sentiment is indecisive about VET. However, there is no notable volume movement in crypto right now. The resistance and 200-moving average have rejected the price and are finding support on the 50-moving average.
VeChain Price Technical Analysis
EMA: VeChain price has been stuck between 50 and 200 MAs with a bearish crossover that shows the influence of sellers in the market. If sellers continue to drag the market down, VET could suffer more falls and go into a downtrend.
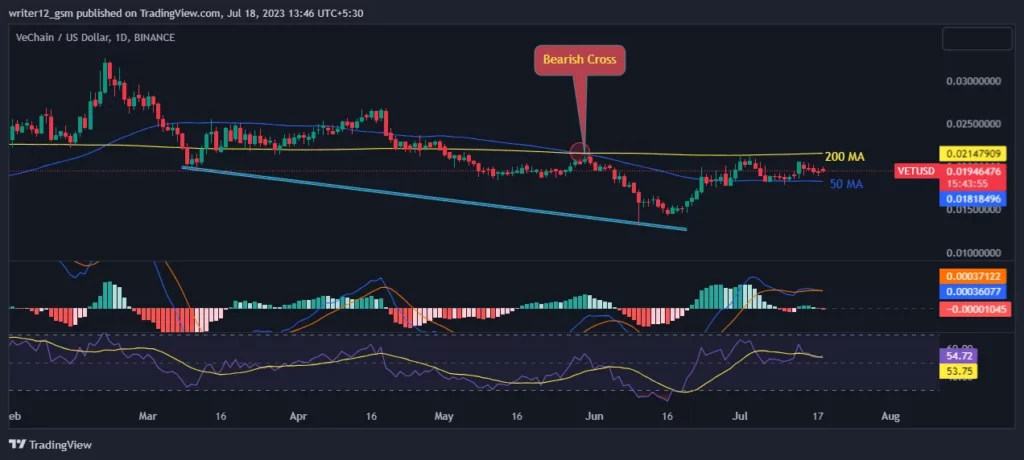
The RSI line is heading toward the overbought zone. The RSI line is at 52.81. The 14 SMA has a value of 53.61 points. However, the VET price could rise significantly if it breaks out of this channel pattern.
Currently, the MACD is showing bullish signs. The MACD line at 0.00036733 and the signal line at 0.00034133 are above the zero line, meaning that the MACD is in positive territory and is giving bullish signs.
The Supertrend indicator recently shows a green signal, reinforcing the bullish sentiment and suggesting that VET will likely start its upward trend in the upcoming days, offering potential opportunities for traders and investors.
Volume Analysis
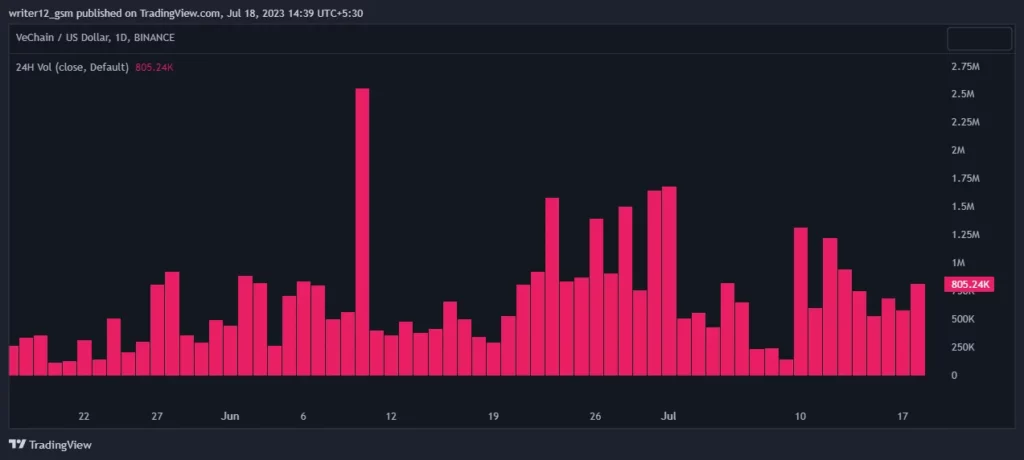
VeChain trading volume for the last 24 hours is $40,780,153, with a 7.50% rise. However, the volume has been decreasing for a long time.
Conclusion
VeChain (VET) faces a tough challenge to escape a downward pattern with two barriers: a trendline and the 200-day EMA. The price movement indicates that the investors must wait for a suitable setup for the next direction. VET’s price is in a balanced zone right now. Furthermore, indicators such as the EMA, RSI, and MACD show bullish signs for VeChain crypto. The current situation requires traders and investors to be calm and watch for a definite break below or above the range before taking any actions in the future.
Technical Levels:
- Support – The current support level is $0.0182347.
- Resistance –The current resistance level is $0.021578.
Disclaimer
The analysis given in this article is for informational and educational use only. Do not use this information as financial, investment, or as trading advice. Investing and trading in crypto is a risky task. Please consider your circumstances and risk profile before making any investment decisions.
Steve Anderson is an Australian crypto enthusiast. He is a specialist in management and trading for over 5 years. Steve has worked as a crypto trader, he loves learning about decentralisation, understanding the true potential of the blockchain.


