
 Home
Home News
News
- 1 MKR price fetched a three-digit mark ($1000) in the last session.
- 2 Bulls are regaining strength and sustaining above the neckline of $1000.
Maker price shows buyers’ accumulation and strength on the charts sustaining above the resistance of $1000. Moreover, the volume spike showed the investors’ demand for the token and buyers’ traction in the last sessions.
Furthermore, after multiple headwinds, bulls won over the bears and attained a grip above the 20-day EMA. The chart shows a breakout of the flag & pole pattern. Surpassing the neckline shows buyers’ momentum. Buyers are looking to retest the immediate hurdle of $1050,
The price action shows that MKR price has entered the bullish region and shows an incremental move and rebounded from the support of $600 in the past months. However, buyers need to sustain above the round mark of $100 to extend the gains.
If follow-on buying arises, the token price will be $1100. On the other hand, if selling occurs, the price heads towards the immediate support of $880. However, sellers were trapped and covered their positions in the last session.
At the time of writing, MKR price is trading at $1029.80 with an intraday gain of 5.24%, showing massive buying. Moreover, the trading volume increased by 8.98% to $95.25 Million. The pair of MKR/BTC is at 0.03381, and the market cap is $998.80 Billion.
MKR Price Shows a Breakout on Daily Charts

On the daily charts, MKR price noted a breakout and surged above the key moving averages. Furthermore, the trend was strong, and buyers are showing dominance and have a strong edge now.
As per the Fib levels, MKR price is trading above 61.8% and showing bullishness on the charts. Furthermore, the price escaped above the upper bollinger band, leading to a breakout.
Short Term Charts Show Momentum Shifting of Bulls
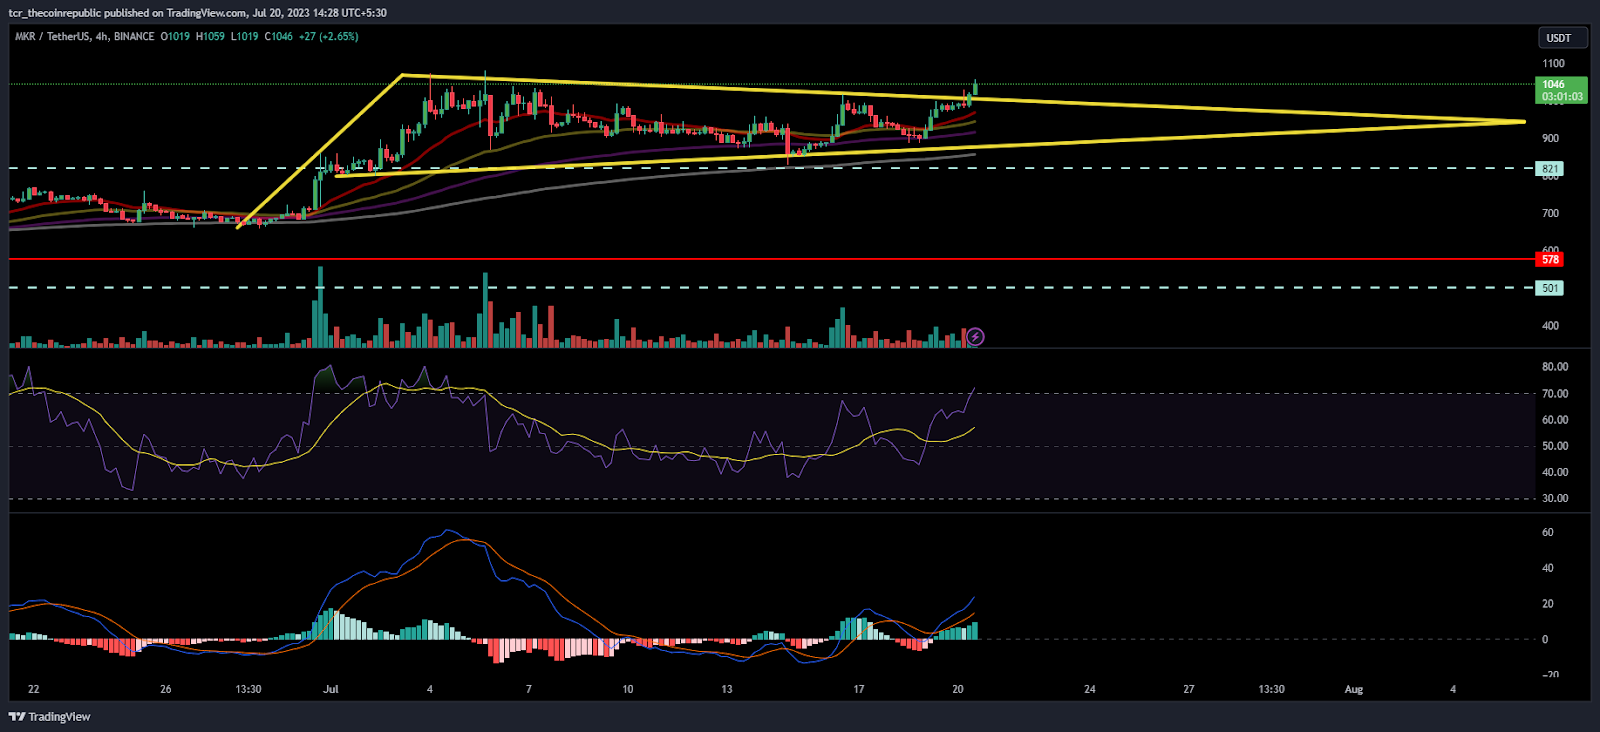
On the 4-hour charts, MKR price escaped the trendline of $1000, showing buyers’ strength in the past sessions. Furthermore, the leading indicators suggest further bullishness, and the uptrend can be extended in the upcoming sessions.
The RSI curve stays above the overbought zone and forms a positive crossover, indicating buyers’ strength on the charts.
The MACD indicator showed green bars and a bullish crossover which indicates a positive outlook for the following sessions.
Conclusion
Maker price is shown riding in an uptrend and continues to extend the rally above $1000, which was the primary hurdle. Moreover, the buyers are gaining strength and looking for further rise.
Technical Levels:
Support Levels: $950
Resistance Levels:$1100
Disclaimer
The views and opinions stated by the author, or any people named in this article, are for informational purposes only and do not establish financial, investment, or other advice. Investing in or trading crypto assets comes with a risk of financial loss.

Adarsh Singh is a true connoisseur of Defi and Blockchain technologies, who left his job at a “Big 4” multinational finance firm to pursue crypto and NFT trading full-time. He has a strong background in finance, with MBA from a prestigious B-school. He delves deep into these innovative fields, unraveling their intricacies. Uncovering hidden gems, be it coins, tokens or NFTs, is his expertise. NFTs drive deep interest for him, and his creative analysis of NFTs opens up engaging narratives. He strives to bring decentralized digital assets accessible to the masses.


