
 Home
Home News
News
- 1 PGR stock price fell by 11.05% over the past seven days.
- 2 Progressive Corporation (NYSE: PGR) stock’s 52-week price range is $110 – $149.
While the Insurance industry’s earnings increased by 12.8% each year on average, Progressive’s earnings fell by -11.7% annually. SimplyWall St., a financial website that offers stock analysis and insights, reported that Progressive’s revenues also rose by an average of 11.1% per year. The company has a return on equity of 10.4% and a net margin of 3.1%.
Progressive’s debt-to-equity ratio is 41.2%, which means it has $6.9 Billion of debt and $16.7 Billion of equity. According to SimplyWall St., Progressive’s total liabilities are $66.2 Billion and its total assets are $82.9 Billion. The company’s interest coverage ratio is 9.5, based on its EBIT of $2.4 Billion. It also has $1.5 Billion in cash and short-term investments.
The market capitalization of PGR stock is $69.202 Billion and the total revenue is $49.59 Billion. Moreover, the stock’s basic EPS is $2.94 and the price-to-earnings ratio is 40.4. Moreover, the average volume is 3.394 Million and the current volume is 2.947 Million, the current volume is below average volume.
Moreover, the stock has not done well this month, decreasing by -8.40% and it has dropped by -6.57% in the last six months. Progressive Corporation (NYSE: PGR) stock has a negative year-to-date return of -8.62% and a positive 1-year return of 6.26%.
Technical Analysis of PGR Stock Price in 1-D Timeframe
The price action shows that PGR stock price ( NYSE: PGR) has been struggling to rebound from the major demand zone around $109.92 for most of 2022. PGR stock finally succeeded in mid-October 2022 when PGR stock formed a rising wedge pattern, which is a bearish reversal pattern that starts with an uptrend and ends with a downtrend. The stock price was in a channel moving upwards, making higher highs and higher lows for six months. It reached a high of $149.77 on April 11, 2023.
Thereafter, the PGR stock price broke down from the wedge and fell roughly 20% within a month, reaching a support level at $121.19 on May 4, 2023. The PGR price tried to reverse from this level, but faced rejection near $136.90 and entered a narrowing range, which eventually formed a symmetrical triangle pattern. This is a neutral pattern that indicates consolidation before a breakout in either direction.
However, PGR stock chose the downward direction and broke down from the triangle on July 12, 2023. Since then, the PGR price has been making lower highs and lower lows. The PGR share price is currently trading at $118.22 (at press time), with volume below the volume moving average. If the PGR price fails to sustain this level, it could continue to fall and reach the first and second downward targets of $111.92 and $106.41 respectively. Alternatively, if the PGR price bounces from this level, it could rise and reach the nearest resistance levels of $126.44 and $135.31.
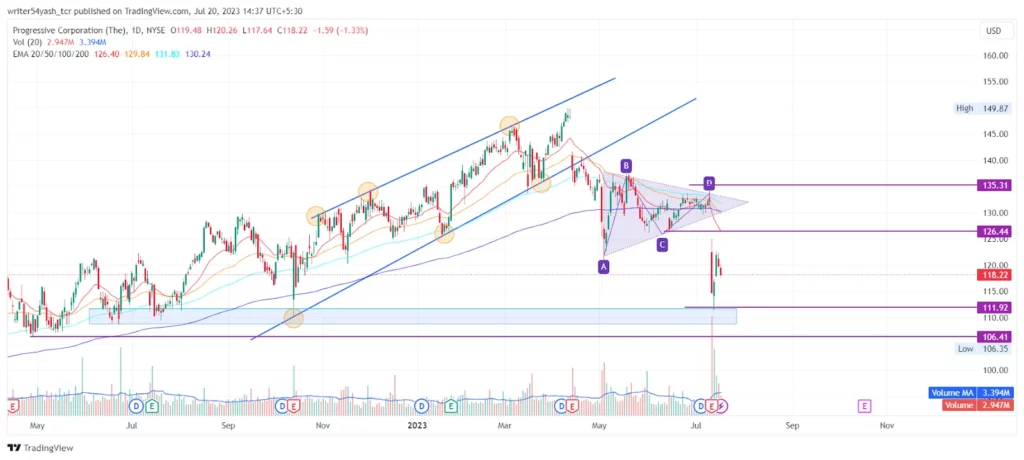
At the time of publishing, PGR share price (NYSE: PGR) is trading below the 20, 50, 100, and 200-day EMAs (exponential moving average), rejecting the price trend. Hence, PGR price is expected to move downwards, giving bearish signals over the daily time frame chart.
The current value of RSI is 33.67 points. The 14 SMA is below the median line at 43.95 points which indicates that the price is bearish as the RSI is in bearish territory.
The MACD line at 3.11 and signal line at 1.69 are below the zero line and a bearish crossover was observed in the MACD oscillator which signals more bearishness for PGR stock.
Summary
PGR stock price shows that the investors and traders of the stock are bearish on the 1-D time frame. The price action shows a bearish outlook at the time of publishing. Technical parameters of the PGR stock also support the bearish trend. The major indicators MACD, RSI, and EMA are giving negative signals and imply that the downtrend may continue in Progressive Corporation (PGR) stock.
Technical Levels
- The nearest support levels: $111.92 and $106.41.
- The nearest resistance levels: $126.44 and $135.31.
Disclaimer
In this article, the views and opinions stated by the author, or any people named are for informational purposes only, and they don’t establish the investment, financial, or any other advice. Trading or investing in cryptocurrency assets comes with a risk of financial loss.

With a background in journalism, Ritika Sharma has worked with many reputed media firms focusing on general news such as politics and crime. She joined The Coin Republic as a reporter for crypto, and found a great passion for cryptocurrency, Web3, NFTs and other digital assets. She spends a lot of time researching and delving deeper into these concepts around the clock, and is a strong advocate for women in STEM.


