
 Home
Home News
News
- 1 The S&P 500 Index. price is trading at $4565.71 currently with a market capitalization of $2.535 Trillion.
- 2 SPX index gave more than 18% return to their investors in a year.
The S&P 500 index, or Standard & Poor’s 500 index, is a stock market index that measures the performance of 500 of the biggest publicly traded companies in the United States. The index represents about 80% of the total market value of the U.S. stock market and is widely considered the best single indicator of large-cap U.S. equities. The index was introduced in 1957 by the credit rating agency Standard and Poor’s.
The S&P 500 index (SPX) closed at 4,565.71 on July 19, 2023, slightly rising by 0.24% from the previous day. The index has gained 18.86% year-to-date, reflecting the strong recovery of the U.S. stock market from the pandemic-induced slump. The index reached its all-time high of 4,536.95 on July 16, 2023, and its 52-week low of 3,233.94 on July 24, 2022.

Weekly Analysis of the SPX Index
The price of the S&P 500 Index. has climbed beyond the 50 and 200-day moving averages in the weekly chart, indicating strong bullish momentum. The market is optimistic about SPX’s performance. Moreover, the weekly RSI and MACD are also in favor of the bulls.
SPX index Price Technical Analysis
S&P 500 Index. is showing bullish solid momentum as its price has risen above the 50-day and 200-day moving averages. The price could start a new uptrend and move higher if the buying pressure persists. Moreover, the bullish signal on the daily chart confirms the positive outlook.
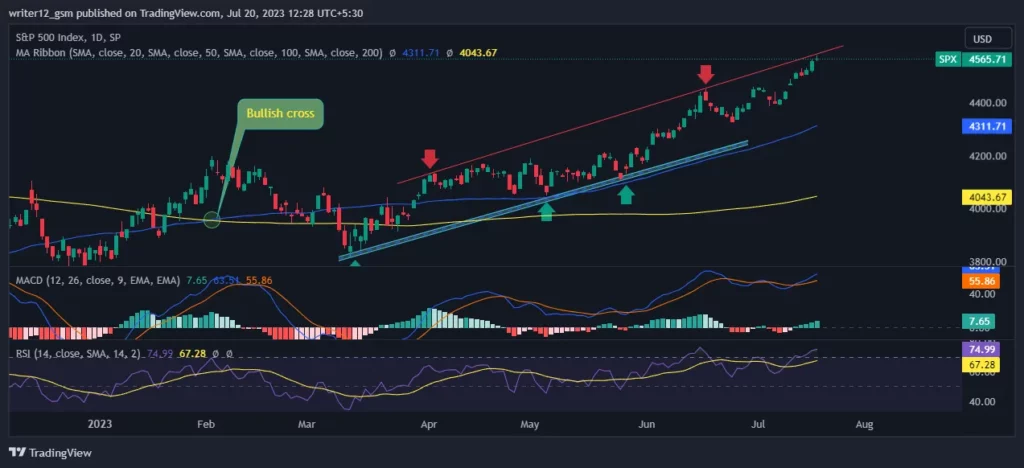
SPX index chart is showing mild bullish signs according to the technical indicators MACD, RSI, and super trend. The MACD line has moved above the signal line, signaling bullish strength. The RSI is close to 50, showing a positive trend. The super trend line is below the price, confusing the trend. These indicators imply that the SPX index is in a mild bullish trend and may keep rising if buyers support the price.
Conclusion
S&P 500 Index.is reaching new highs while it reports an increase in its earnings.SPX hit higher highs and surpassed the 50- and 200-day moving averages on daily and weekly time frames. The RSI, MACD, moving averages and super trend are all positive, signaling a strong uptrend.
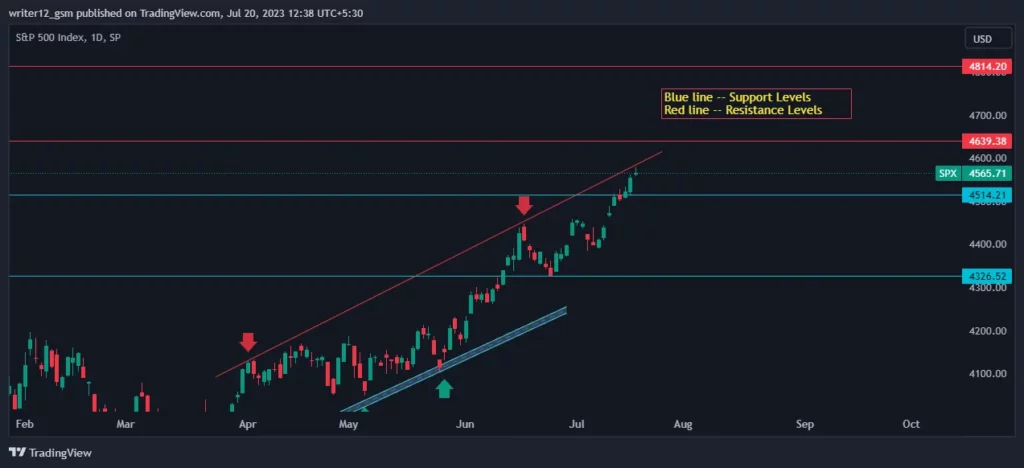
Technical Levels:
The chart shows that the price faces strong resistance at $4639.38 and $4814.20 and strong support at $4514.21 and $4326.52. A breakout above or below these levels could signal a new trend direction.
Disclaimer
The SPX index price prediction given in this article is for informational and educational use only. Do not use this information as financial, investment, or as trading advice. Investing and trading in the index is a risky task. Please consider your circumstances and risk profile before making any investment decisions.

With a background in journalism, Ritika Sharma has worked with many reputed media firms focusing on general news such as politics and crime. She joined The Coin Republic as a reporter for crypto, and found a great passion for cryptocurrency, Web3, NFTs and other digital assets. She spends a lot of time researching and delving deeper into these concepts around the clock, and is a strong advocate for women in STEM.


