
 Home
Home News
News

- 1 Exela Technologies, Inc. is currently trading at $5.26 with a 2.53% rise in the past 24 hours. However, the share price rose by 3.34% in the last 7 days.
- 2 Exela Technologies, Inc.’s average trading volume for the last 3 months is $2.53 Million. The average volume for the last 10 days is $280.24 K.
Exela Technologies Inc. specializes in business process automation and information management solutions for various industries. It has its headquarters in Irving, Texas, and operates in more than 50 countries. Exela provides solutions such as cloud computing, data analytics, digital mailroom, healthcare services, intelligent lockers, and robotic process automation. Established in 2017, Exela Technologies Inc. is traded on the Nasdaq stock exchange with the symbol XELA.

The stock of Exela Technologies Inc. has shown strong growth in the past quarter. It has a range of $2.62 to $620.00 in the past 52 weeks.

XELA has a market value of $33.512 Million. In 2022, it earned $1.08 Billion in revenue and -$415.58 Million in net income. Its net profit margin was -38.58% for 2022. The company owes $1.15 Billion in debt with a negative free cash flow of -105.46 Million, and it also has $45.07 Million in cash and equivalents.
Exela Technologies, Inc. Stock Price Technical Analysis
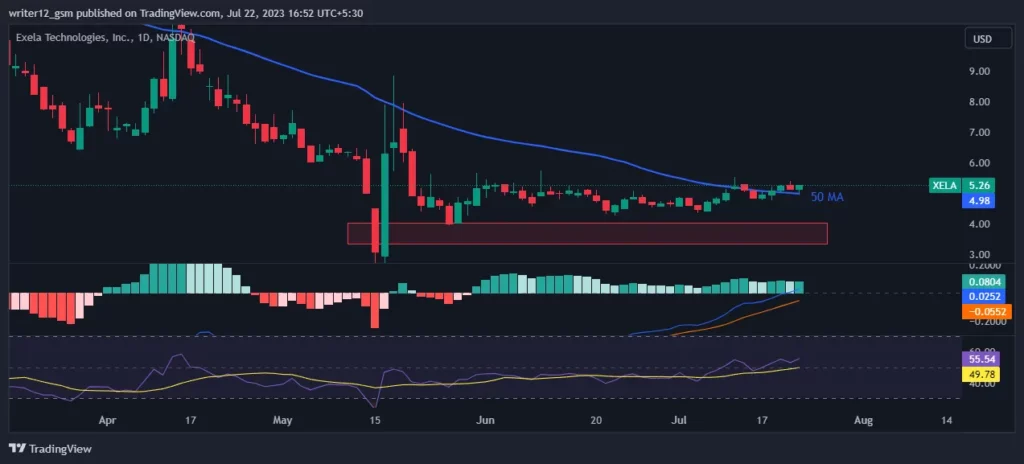
XELA stock price is displaying mild bullish momentum as its price has traded between the 50-day and 200-day moving averages. The stock broke the 50 moving average recently, and retesting it right now. It seems that if buyers persist, it will grow more in the upcoming days.
The MACD line has crossed above the signal line, which is a positive sign. Currently, the MACD is at 0.0804 points and the signal line is at -0.0552 points, and the MACD line is above the zero line showing a positive outlook.
The RSI is above the median line, reflecting a neutral trend. Currently, the RSI is at 55.54 points and the 14-day SMA line is at 49.78 points, and both are close to the median line and are giving a neutral outlook.
The super trend line is below the price, showing a red signal and suggesting a positive trend.
Summary
The chart of Exela Technologies, Inc. stock shows a mild bullishness at the moment. The technical indicators MACD, RSI, and super trend are giving positive signals, suggesting that the XELA stock is in a bullish trend. The current situation requires traders and investors to be patient and look for a clear break below or above the range before making any moves and avoid the fear of missing out to minimize losses.
Technical Levels
- Support Level – The current support level is $4.11.
- Resistance Level – The current resistance level is $6.85.
Disclaimer
This article is only for information and education purposes. Do not use this information as financial or trading advice. Trading and investing have financial risks. Before making any investment or trading decision, please think about your risk tolerance and situation.

With a background in journalism, Ritika Sharma has worked with many reputed media firms focusing on general news such as politics and crime. She joined The Coin Republic as a reporter for crypto, and found a great passion for cryptocurrency, Web3, NFTs and other digital assets. She spends a lot of time researching and delving deeper into these concepts around the clock, and is a strong advocate for women in STEM.


