
 Home
Home News
News

- 1 TRX price noted a sharp up move in the form of a breakout last session.
- 2 Bulls continue to accumulate and are willing to catch $1.00.
Tron (TRX) price noted a breakout above the hurdle of $0.08000, surpassing significant moving averages decisively. However, the mighty bears pushed bulls backward, and a long rejection wick was spotted on the charts signalling sellers’ grip near $0.0900.

Although this inclining move made sellers trouble, a short covering move was noted, which was an early indication of an upcoming rally. Furthermore, Tron price shows that buyers persisted in accumulating the coin and were willing to reach the mark of $1.00.

From the start of 2023, TRX price traded inside the rising parallel channel and rode the uptrend convincingly. Furthermore, the volume spike shows the demand among the investors, which indicates buyers are speculative.
The chart structure indicates that Tron price persists in riding high as the bulls have attained strong momentum smashing hurdles decisively. The trajectory swings indicate that TRX is near the round mark, and a massive long addition was noted there, indicating buyers’ accumulation and willingness to reach that spot.
At the time of writing, Tron price is trading at $0.0860 with an intraday gain of 6.12%, showing massive breakout and bullishness on the charts. Moreover, the intraday trading volume surged by 9.12% to $669.24 Million. However, the pair of TRX/BTC is at 0.0000029 BTC, and the market cap is $7.72 Billion.
TRX Looking To Escape Channel Highs On Daily Charts
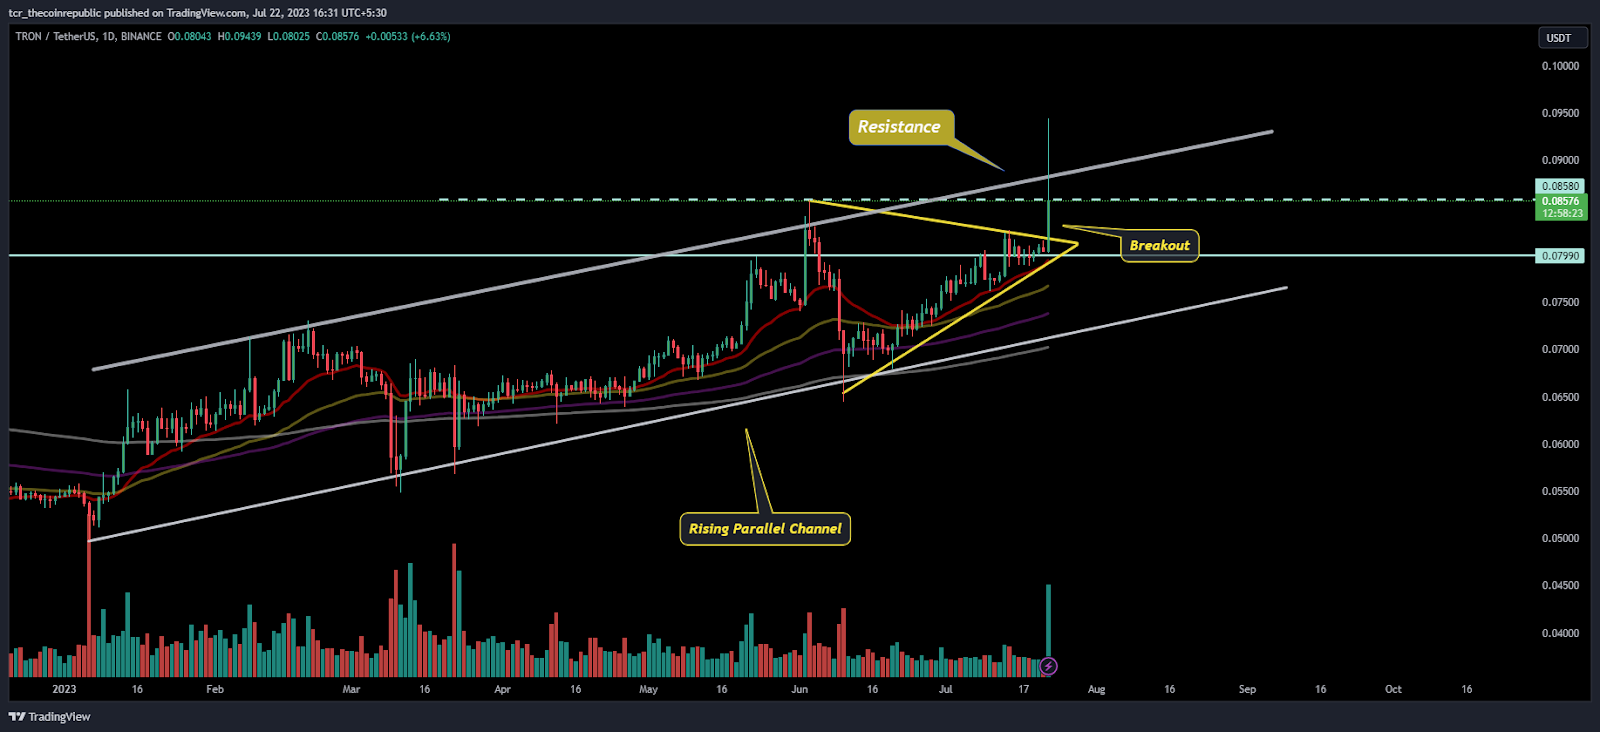
On the daily charts, the TRX price showed rejection from the upper trendline of the rising parallel channel indicating buyers’ accumulation on the charts. Moreover, the price crossed the 20-day EMA and picked up momentum.TRX’s price surpassed the upper bollinger band, demonstrating a symmetrical triangle pattern breakout.
Furthermore, the technical parameters suggest that TRX price is heading towards the next targets of $0.09000, followed by $0.09200 and $0.096000 per the Fib extension indicator. Also, the coin is trading in uncharted territory where the upside has broader targets to fetch, whereas the downside is capped at $0.075000.
TRX Short Term Charts Shows Buyers Accumulation
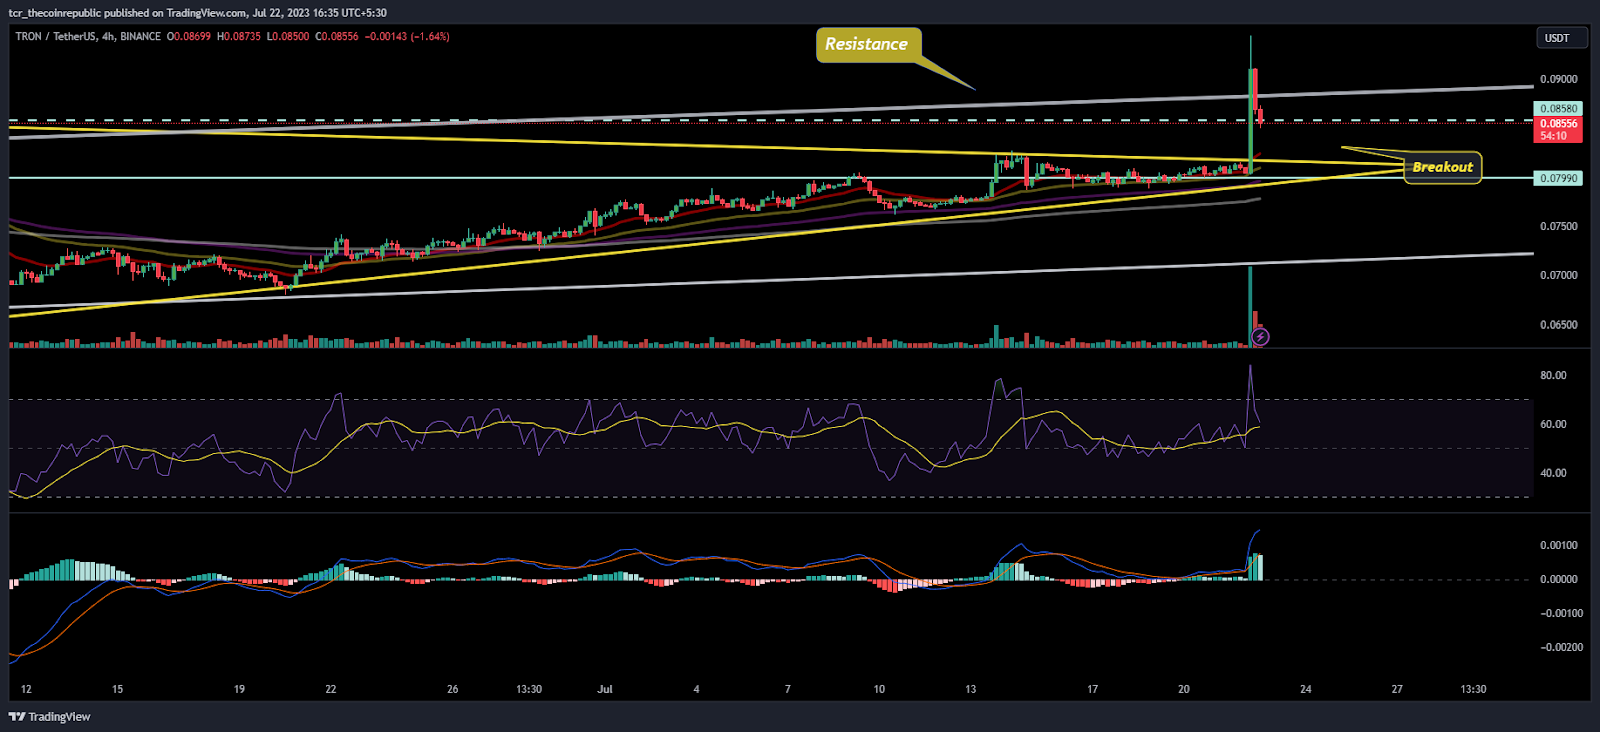
On the 4-hour charts, TRX escaped the neckline of $0.0800 and met a strong supply zone of $0.09500 but could not surpass and again retraced to retest the strength near $0.08500. However, this inclination indicates buyers want to win the battle and attain dominance.
The RSI curve stayed in the buying region, retraced from the overbought zone of 80 and returned toward 65, showing rejection from the top. However, buyers managed the gains and stayed price above the congestion range.
The MACD indicator showed a bullish crossover, indicating buyers’ dominance on the charts.
Conclusion
Tron (TRX) price escaped the neckline of $0.08000 and showed bullishness, attaining momentum, heading toward the round level of $1.00. However, the sellers seemed to be in trouble as they covered their positions.
Technical Levels:
Support Levels: $0.07800
Resistance Levels:$0.09000 and $0.09600
Disclaimer
The views and opinions stated by the author, or any people named in this article, are for informational purposes only and do not establish financial, investment, or other advice. Investing in or trading crypto assets comes with a risk of financial loss.
Steve Anderson is an Australian crypto enthusiast. He is a specialist in management and trading for over 5 years. Steve has worked as a crypto trader, he loves learning about decentralisation, understanding the true potential of the blockchain.


