
 Home
Home News
News
- 1 The price of yearning. finance (YFI) is trading at around $6855. However, the crypto’s price gained by 0.35% in the last 24 hours (press time).
- 2 YFI price observed a decrease of -6.85% in the last 7 days.
- 3 The market capitalization of yearning. Finance is currently near $226.351 Million.
Yearn.finance crypto trading in a channel pattern that has two barriers: a trendline and the 50-day EMA. The crypto’s next move will depend on whether it can break out above or break below the pattern.

The trading volume of yearn.finance (YFI) is $14,363,508 in the last 24 hours, which is a -3.40% drop from one day ago and indicates a recent decline in market activity.

The highest price achieved by yearn.finance (YFI) is $90,786.89, which was reached on May 12, 2021 (about 2 years ago). Compared to that, the current price is -92.46% lower than the all-time high price.
The current market sentiment is uncertain. There is no significant volume in crypto right now. The price bounced off the resistance line and is finding support on the 50-moving average.
Yearn.finance Price Technical Analysis
Yearn.finance price has been stuck between 50 and 200 MAs with a bullish crossover that shows the influence of buyers in the market. However if bears continue to drag the share down, YFI could suffer more falls and go into a downtrend.
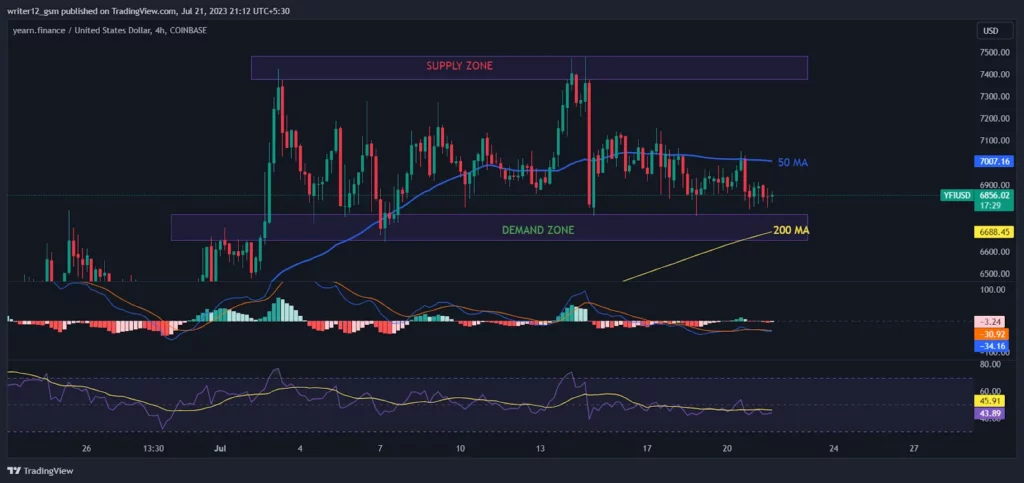
As the RSI line approaches the overbought zone, it is at 43.89. The 14 SMA is 45.91 points higher. YFI price has the potential to surge if it escapes this channel pattern.
MACD indicates a bearish trend. The MACD line is -34.74 and the signal line is -31.04, both above the zero line, which means that the MACD is in negative territory and is giving bearish signs.
Conclusion
The current data and analysis of YFI price indicate that bears and bulls are in a close fight. Yearn.finance (YFI) is trying to break out of a downward pattern that has two barriers: a trendline and the 50-day MA. Considering the price action, the investors might have to wait for a proper setup for the next move. YFI’s price is in neutral territory at the moment. Moreover, indicators such as the MA, RSI, and MACD are giving bearish signals about yearn.finance .crypto The current situation requires traders and investors to be patient and look for a clear break below or above the range before making any moves in the future.
Technical Levels:
- Support – The current support level is $6500.23.
- Resistance –The current resistance level is $7130.00
Disclaimer
The analysis given in this article is for informational and educational use only. Do not use this information as financial, investment, or as trading advice. Investing and trading in crypto is a risky task. Please consider your circumstances and risk profile before making any investment decisions.

Nancy J. Allen is a crypto enthusiast, with a major in macroeconomics and minor in business statistics. She believes that cryptocurrencies inspire people to be their own banks, and step aside from traditional monetary exchange systems. She is also intrigued by blockchain technology and its functioning. She frequently researches, and posts content on the top altcoins, their theoretical working principles and technical price predictions.


