
 Home
Home News
News
- 1 SO stock escaped the congestion zone and moved out of the cage.
- 2 Bulls are looking to surpass the immediate hurdle of $75.
Southern Company (SO stock) price escaped the consolidation phase and showed a breakout, surpassing the neckline of $72 in the last session. Buyers are regaining their strength.
Reports suggest that Georgia Power, a subsidiary of Southern Company, has stepped up in the ongoing project of a new reactor named “ Vogtle 4”, which is all set to launch at the end of 2023 or early 2024. The reactor has passed the ITAACs – Inspection, Tests, Analyses and Acceptance criteria. This is the necessary procedure and must be completed before fuel can be loaded into a new reactor.
The chart shows that SO stock remained in the narrow range from the past sessions, has now left the neckline of $72, and shows a glimpse of bullishness for the following sessions. If further buying arises and the stock rises, it will reach $75 to retest the strength.
The Southern Co. is a holding company, which engages in the generation and sale of electricity. It operates through the following segments: Traditional Electric Operating Companies, Southern Power and Southern Company Gas. The Traditional Electric Operating Companies segment refers to vertically integrated utilities that own generation, transmission and distribution facilities, and supply electric services in the states of Alabama, Georgia, Florida, and Mississippi.
The Southern Power segment constructs, acquires, owns, and manages generation assets such as renewable energy projects and sells electricity in the wholesale market.
At press time, SO stock was traded at $73.06 with an intraday gain of 2.80%, showing a breakout in yesterday’s session. Moreover, the trading volume increased by 2.17% to 5.326 Million, and the market cap is $79.665 Billion.
SO Stock Shows a Breakout On Daily Charts
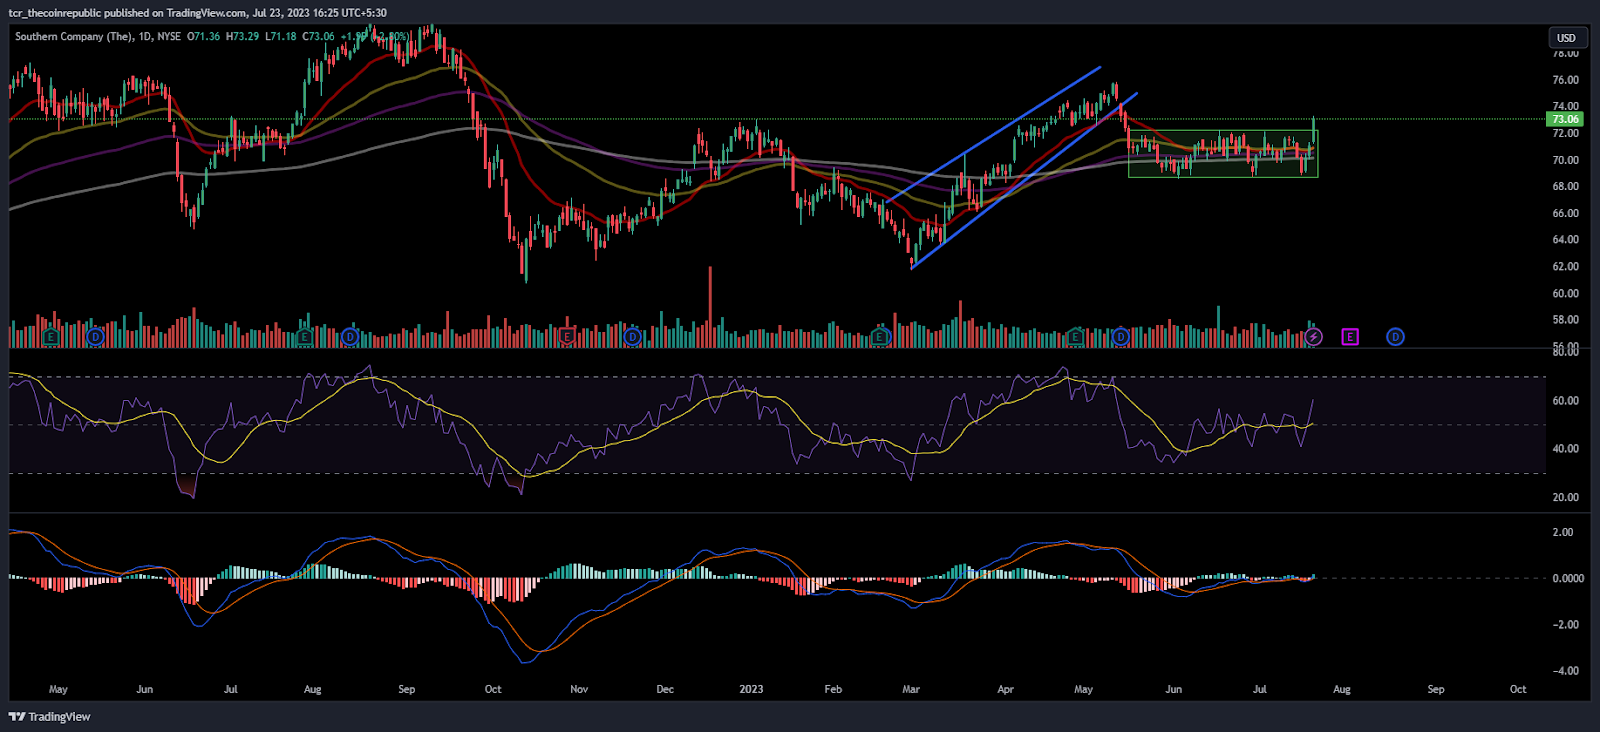
On the daily charts, SO stock showed a breakout and escaped the neckline of $72, indicating buyers’ accumulation. Moreover, the price trades beyond the significant moving averages and initiates fresh buying above the congestion zone. However, buyers have another challenge – to escape $75 for extending the bullishness.
As per the Fib levels, SO stock was trading above 50% and made a bullish marubozu candle close to 61.8% in the last session. Moreover, the price is near the upper bollinger band, managing the gains.
The RSI curve sustained above neutrality and shows a positive crossover suggesting that buyers have entered the battle and are now looking to defeat bears.
The MACD indicator shows tiny moves and convergence of the MA line with the signal line. However, it indicates further buying with the trajectory targets of $75 followed by $80.
Conclusion
Southern Company (SO) stock price indicates a fresh breakout and is looking to retest the swing highs near $80 in the following sessions.
Technical Levels:
Support Levels: $70 and $65
Resistance Levels:$$75 and $80
Disclaimer
The views and opinions stated by the author, or any people named in this article, are for informational purposes only and do not establish financial, investment, or other advice. Investing in or trading crypto assets comes with a risk of financial loss.

With a background in journalism, Ritika Sharma has worked with many reputed media firms focusing on general news such as politics and crime. She joined The Coin Republic as a reporter for crypto, and found a great passion for cryptocurrency, Web3, NFTs and other digital assets. She spends a lot of time researching and delving deeper into these concepts around the clock, and is a strong advocate for women in STEM.


