
 Home
Home News
News
- 1 Baidu stock price closed at $141.50 with a loss of 1.07% during the last intraday session.
- 2 Baidu stock has crossed the 20-day EMA negatively but still trades above 50,100 and 200-day EMAs.
- 3 The year-to-date return of Baidu stock is 19.05% while the one-week return is -5.95%.
Baidu stock price had a drastic fall of roughly 27% on April 2023 as it fell from $160 to $116.50 and formed a support. The support helped the price in regaining bullish momentum. The stock price shattered the resistance level of $133 and began to rise toward $150.
Baidu stock did rise above $150 but the move was halted at $152.44. There was a strong presence of bears above $150 which pushed the price back below it. Currently, the stock price is correcting the bullish move.

The candle of 20 July 2023 closed bullish but with a long upper wick suggesting the sellers are present in the market. The last candle broke the low of the 20th July candle and is headed toward the support level of $134.
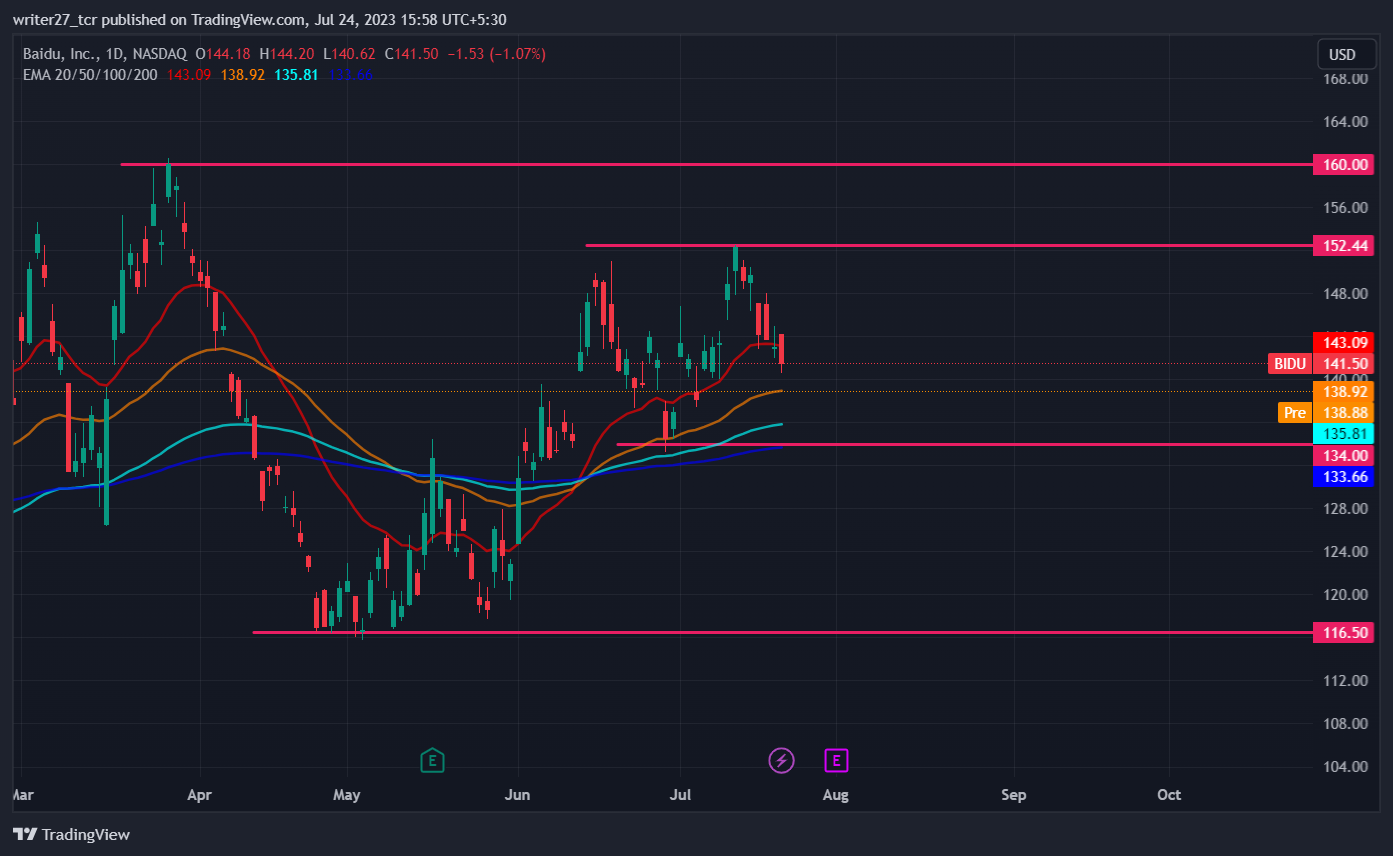
If bears can push the price below the psychological level of $140, there is a possibility for the price to melt toward $134 causing a loss of 4.28%.
On the other hand, if the price can form a support at $140, there is a chance that it might retest the resistance level of $152.44.
Earning Result Expectations
The Quarter 2 earnings report of Baidu is to be released on 1st August 2023. The consensus has estimated the revenue to be $4.602 Billion and earnings per share to be $2.33. The stock slumped yesterday due to its benchmark hang seng falling over 2%.
Analysts stated that the revenue of Baidu is likely to rise by 12% on year in Quarter 2. It is driven by improving conversion from traffic to sales.
The Quarter 2 earnings from online marketing are also likely to rise by 12%. The analysts are maintaining a buy rating and price target of $214.
Will BIDU Stock Price Break Above $150 if Earning Results Are Positive?
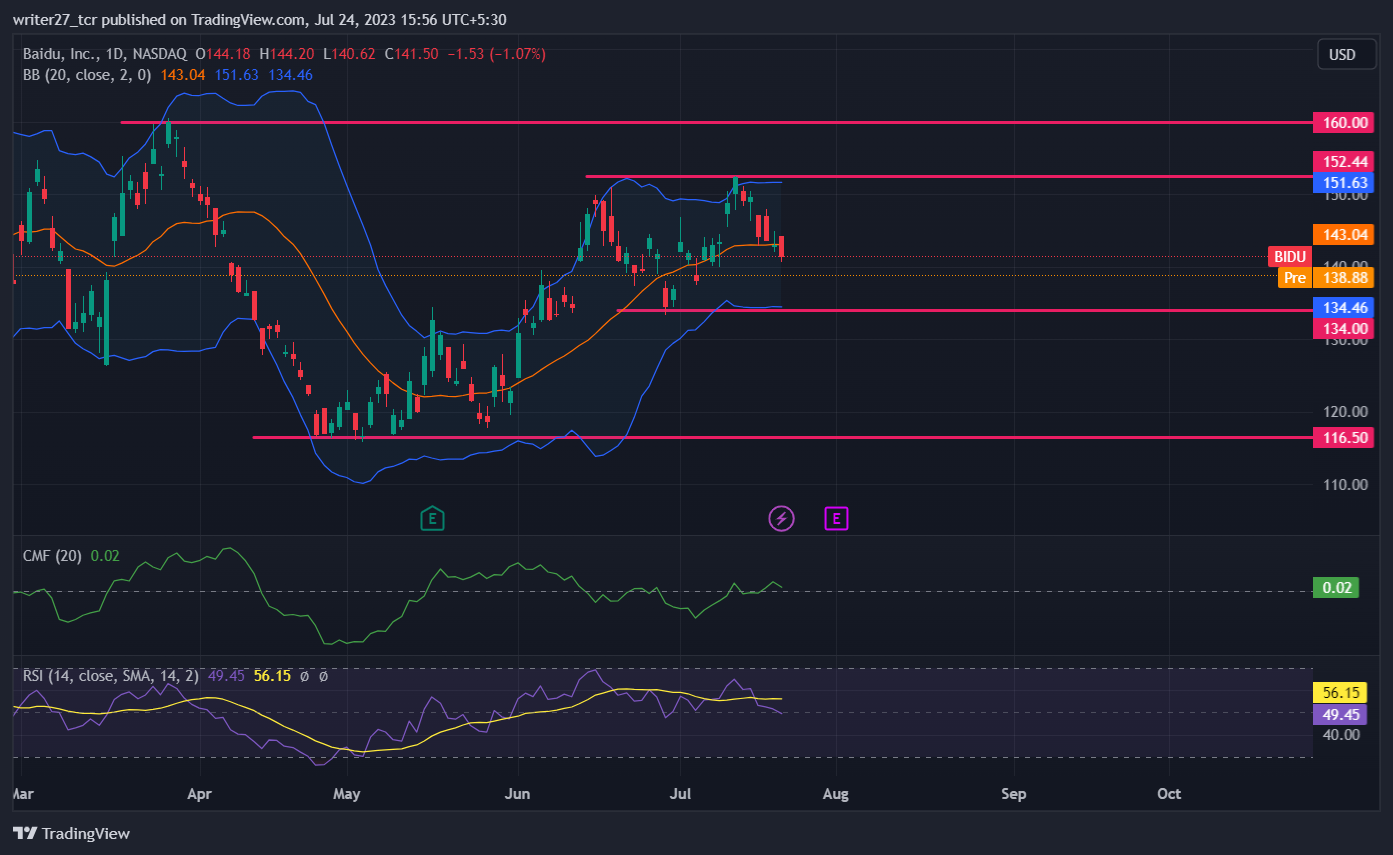
The BIDU stock price has crossed the 20-day EMA negatively suggesting rising bearish momentum in the price. The 50-day EMA has been acting as support for the price. Chaikin money flow score is 0.02 hinting at slight strength in the market.
The relative strength index (RSI) traded at 49.45 implying that the price is in neutral territory facing the same pressure from bulls and bears.
RSI also indicates the possibility of consolidation in the current region before earning results are released.
BIDU stock price touched the upper level and started to retrace. Recently, it crossed the 20-day SMA of Bollinger and is headed in the direction of the lower band which resides near the $134 major support level.
Conclusion
The market structure and price action of Baidu shifted to bearish after the price faced rejection from the $152.44 level. The technical parameters indicate that the price can still rise if it can form strong support.
Technical Levels
- Major support: $134 and $116.50
- Major resistance: $152.44 and $160
Disclaimer
The views and opinions stated by the author, or any people named in this article, are for informational purposes only. They do not establish financial, investment, or other advice. Investing in or trading crypto assets comes with a risk of financial loss.
Mr. Pratik chadhokar is an Indian Forex, Cryptocurrencies and Financial Market Advisor and analyst with a background in IT and Financial market Strategist. He specialises in market strategies and technical analysis and has spent over a year as a financial markets contributor and observer. He possesses strong technical analytical skills and is well known for his entertaining and informative analysis of the Financial markets.


