
 Home
Home News
News
- 1 Coca-Cola’s stock price is trading at $62.44 with a 0.08% rise in the past 24 hours. However, the share price rose by 3.82% in the last 7 days.
- 2 Coca-Cola Company’s average trading volume for the last 24 hours is $12.81 Million. The average volume for the last 10 days is $12.708 Million.
Coca-Cola stock refers to the shares of The Coca-Cola Company (NYSE: KO), a global beverage company that produces, markets, and distributes various non-alcoholic drinks, such as soft drinks, juices, water, sports drinks, and energy drinks.
KO reported strong results for the first quarter of 2023, with a 3% increase in its global unit case volume and a 5% increase in its net revenues. The company also achieved a 12% increase in organic revenues (non-GAAP), which excludes the impact of currency fluctuations, acquisitions, divestitures, and other items.

However, the company’s operating income declined by 1%, partly due to higher costs and expenses. The company’s operating margin was 30.7%, lower than the 32.5% in the same quarter last year.
The comparable operating margin (non-GAAP), which adjusts for certain items affecting comparability, was 31.8%, higher than the 31.4% in the same quarter last year. The company’s earnings per share (EPS) rose by 12% to $0.72, while the comparable EPS (non-GAAP) rose by 5% to $0.68.
Coca-Cola Company Stock Price Technical Analysis
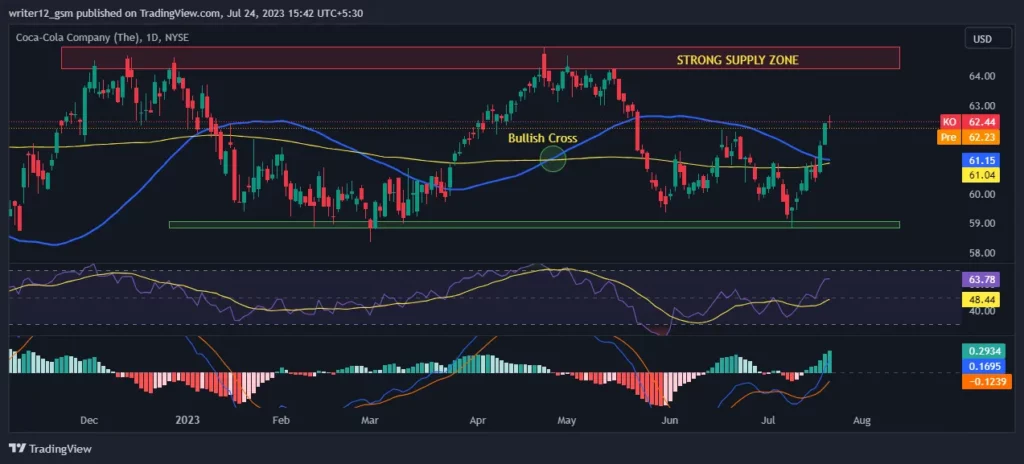
Coca-Cola’s stock price has stopped falling and started to rise. However, it is rising above the 50-day and 200-day simple moving averages (SMAs), which have bullish crosses, signaling the presence of buyers in the market. If buyers keep pushing the price up, KO stock price could rise more and enter an uptrend. The moving average convergence divergence (MACD) indicator is in a positive zone, indicating positive momentum. The relative strength index (RSI) is also near the overbought zone, indicating a positive momentum in the market.
Summary
The Coca-Cola Company reported robust results for the first quarter of 2023, showing growth in volume, revenue, and margins. The company also reaffirmed its full-year guidance, reflecting its confidence in its strategy and execution. The company’s stock price is also rising above the moving averages and the buyers in the market. Technical chart showing the price is trading in a rectangular channel. However, the technical indicators suggest the stock price is in an uptrend and may continue to rise. Investors should look for opportunities to buy the stock or hold their existing positions. Investors should watch for a clear signal from the market before taking any action.
Technical Levels
- Support Level – The current support level is $59.00.
- Resistance Level – The current resistance zone is between the range of $64.25 to $65.00.
Disclaimer
This article is only for information and education purposes. Do not use this information as financial or trading advice. Trading and investing have financial risks. Before making any investment or trading decision, consider your risk tolerance and situation.

Andrew is a blockchain developer who developed his interest in cryptocurrencies while pursuing his post-graduation major in blockchain development. He is a keen observer of details and shares his passion for writing, along with coding. His backend knowledge about blockchain helps him give a unique perspective to his writing skills, and a reliable craft at explaining the concepts such as blockchain programming, languages and token minting. He also frequently shares technical details and performance indicators of ICOs and IDOs.


