
 Home
Home News
News
- 1 The Open Network price is currently trading at $1.397 while witnessing a loss of 0.85% during the intraday session.
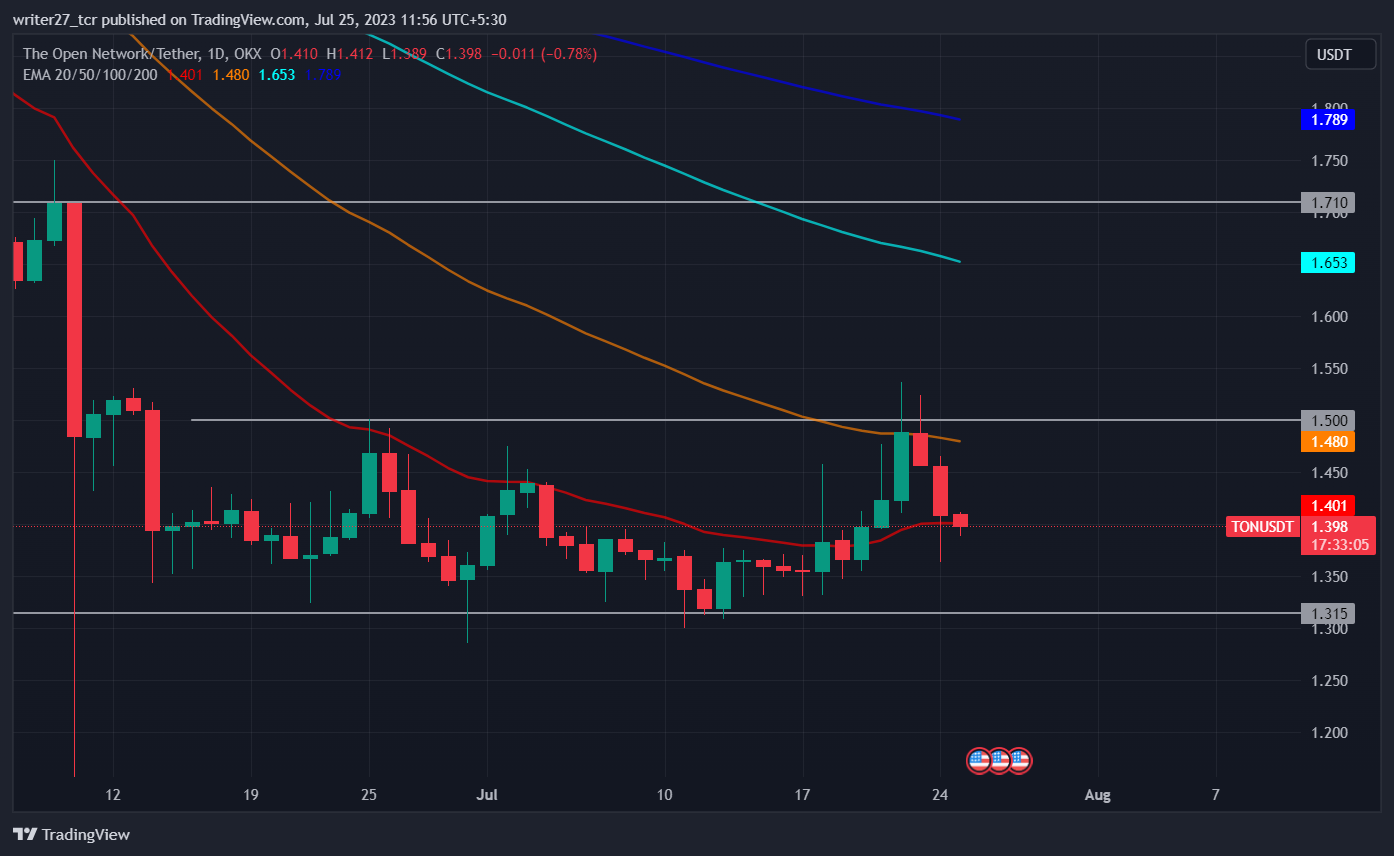
- 2 TON price trades below 20, 50,100, and 200-day EMAs.
- 3 The year-to-date return of The Open Network is -35.87% while one year return is 54.08%.
Ton price has been stuck in a consolidation zone ranging between $1.50 and $1.315 since mid-June 2023. During the start of June, the price was in strong bearish momentum after facing rejection from the $1.71 level.
The news of the Securities and Exchange Commission (SEC) filing a lawsuit against the major cryptocurrency exchange fueled the bearish rally which led to a drastic downfall in the price.

Bears pushed the price below $1 but bulls entered the market and pushed the price above it.
Recently, the Ton price tried to escape the consolidation and rose above the $1.50 level. But the presence of bears was strong which pushed the price back into the zone.
After the rejection, the cryptocurrency price regained bearish momentum and has been declining for the last two days. The current candle is also bearish and is headed in the direction of the $1.315 support level.
However, the current candle has not broken the low of the previous candle and might turn bullish to form a support. The price is hovering near the $1.40 psychological level.
If the price can break the low of the previous candle, it might melt down toward the support level of $1.315. On the other hand, if bulls enter into the market and help the price in forming support, it might retest the resistance level of $1.50.
Quarter 2 Results Of Toncoin
The total number of accounts and transactions on The Open Network has increased to 2.88 Million and 173 Million respectively. The recent update of June 2023 introduced new burn rate functionality implemented by the community and the validators who voted to burn 50% of the network fees, including storage and transaction fees.
Will Ton Price Melt to $1.315 Level?
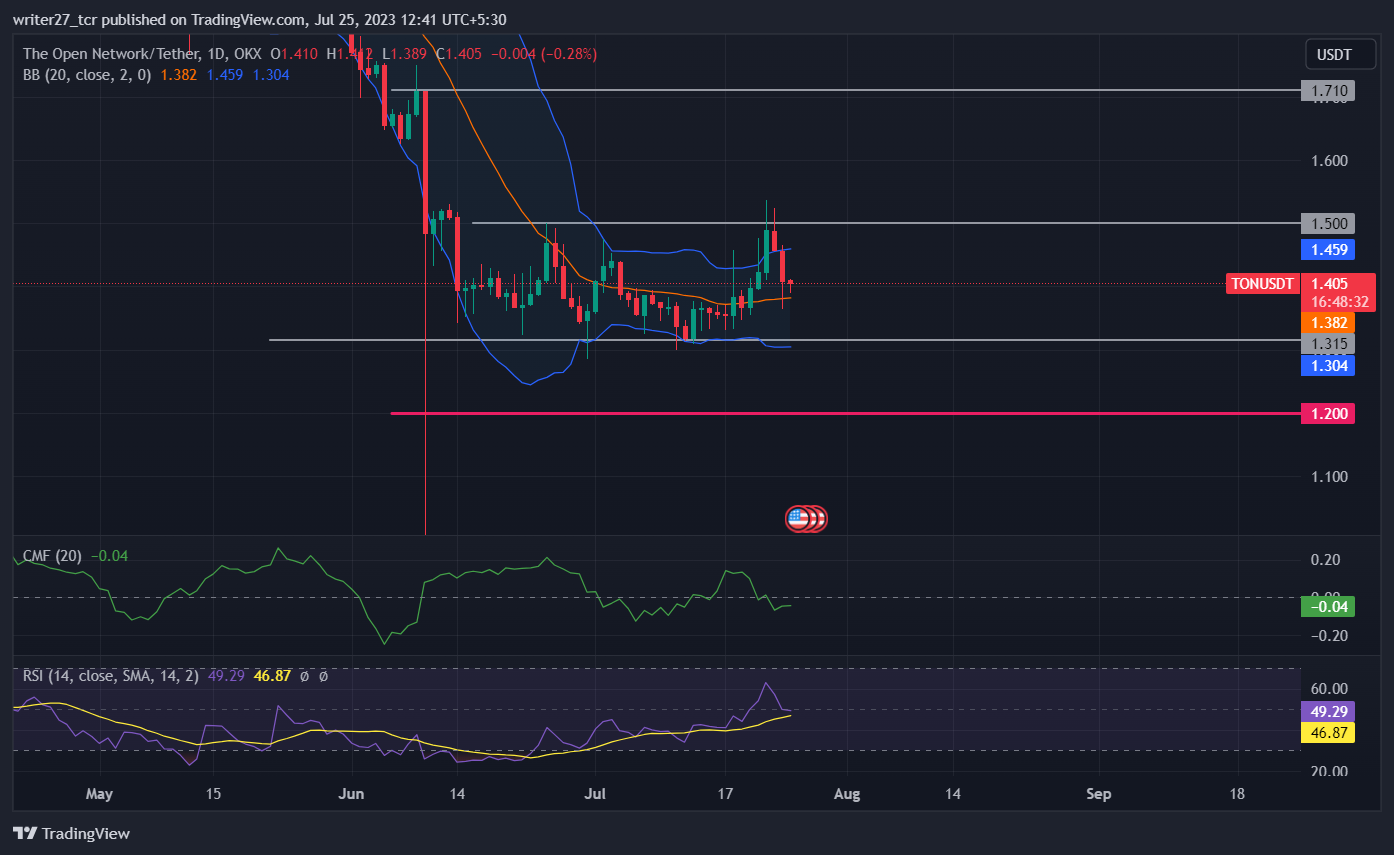
The cryptocurrency price is trading below 20, 50, 100, and 200-day EMAs indicating bearish momentum in the price. Chaikin money flow score is -0.05 implying that there is weakness in the market.
The relative strength index has dropped below the 50 mark and currently trades at 48.57, denoting that price is in neutral territory facing the same pressure from bulls and bears. The Bollinger bands have also contracted indicating low volatility.
The long/short ratio is 0.92 with 48% longs and 52% shorts indicating a higher pressure from the selling side in the last 24 hours.
Conclusion
The market structure and price action of The Open Network has shifted to bearish after it faced rejection from $1.50. Technical indicators suggest that the price is in bearish momentum and it is favoring the selling side.
Technical Levels
Major support: $1.20 and $1.315
Major resistance: $1.50 and $1.70
Disclaimer
The views and opinions stated by the author, or any people named in this article, are for informational purposes only. They do not establish financial, investment, or other advice. Investing in or trading crypto assets comes with a risk of financial loss.

With a background in journalism, Ritika Sharma has worked with many reputed media firms focusing on general news such as politics and crime. She joined The Coin Republic as a reporter for crypto, and found a great passion for cryptocurrency, Web3, NFTs and other digital assets. She spends a lot of time researching and delving deeper into these concepts around the clock, and is a strong advocate for women in STEM.


