
 Home
Home News
News

- 1 AAL stock price decreased by 8.52% over the past seven days.
- 2 American Airlines Group Inc (NASDAQ: AAL) stock’s 52-week price range is $12 – $19.
The earnings and revenues of American Airlines Group have been on a downward trend over the years, as reported by Simplywall Inc., a financial website. The annual decline in its earnings was -13.4% on average, while the airline industry saw a 22.3% average drop in earnings. Its revenues also declined by an average of 0.5% per year.
American Airlines Group has negative shareholder equity of – $4.4 Billion and a high debt level of $34.6 Billion, according to Simplywall Inc. This results in a debt-to-equity ratio of -790.1%. Its total assets and total liabilities are $67.3 Billion and $71.6 Billion respectively. Its EBIT is $5.2 Billion, which gives it an interest coverage ratio of 3.2. It has $12.1 Billion in cash and short-term investments.

The market capitalization of American Airlines Group stock is $10.878 Billion and the total revenue is $48.971 Billion. Moreover, the stock’s basic EPS is $4.04 and the Price-to-Earnings ratio is 4.60. The trading volume is higher than usual, which shows that buyers are trying to maintain their position, but if the buyers lose strength and the sellers increase, the volume may also drop.
The stock has done well this month, increasing by 4.45% and by 0.67% in the last six months. American Airlines Group Inc (NASDAQ: AAL) stock has a positive year-to-date return of 28.97% and a 1-year return of 22.25%.
Technical Analysis of AAL Stock Price in 1-D Time Frame
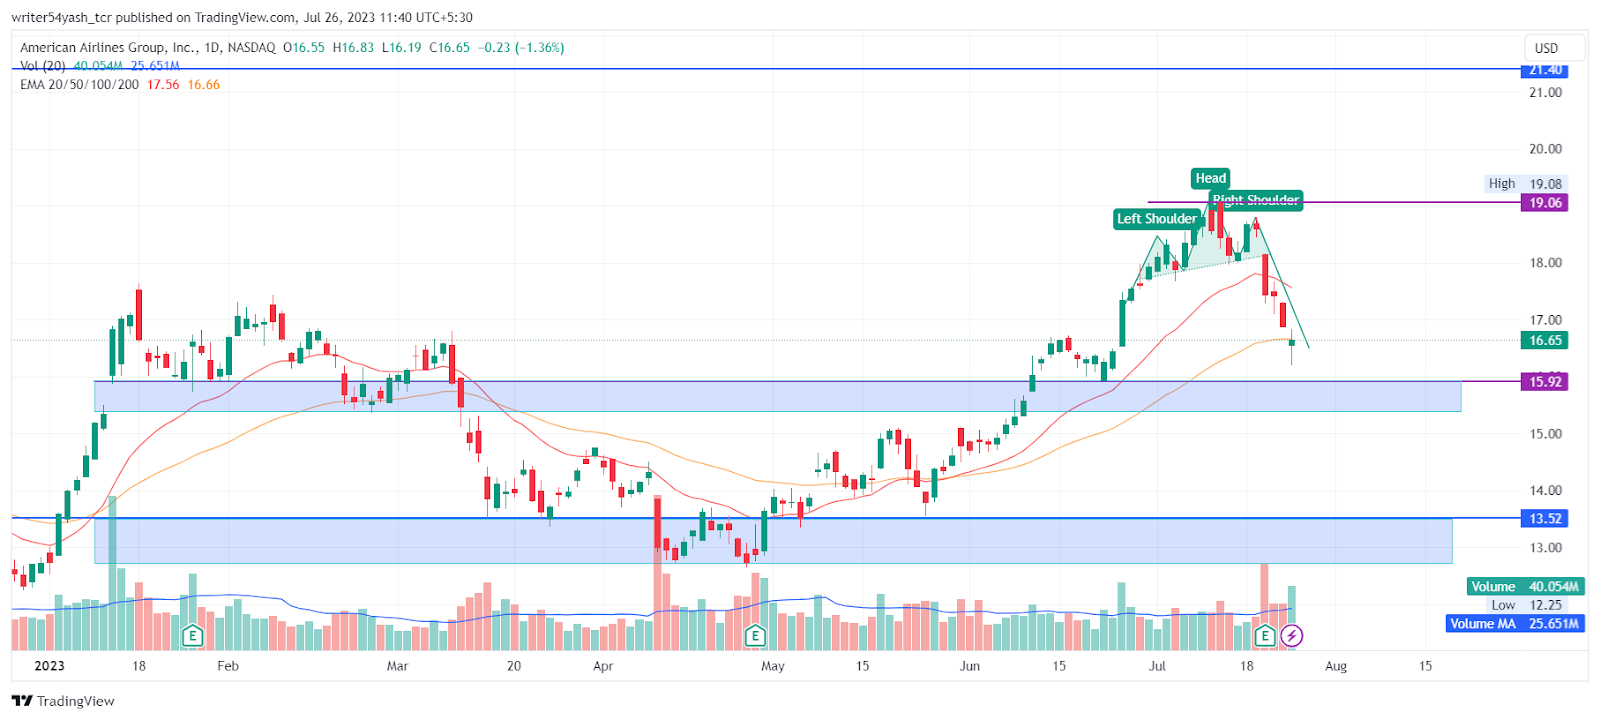
The price action shows that American Airlines Group Inc (NASDAQ: AAL) stock has been in a downward trend after hitting its highest price in mid-January 2023. AAL price dropped by about 28% in four months and reached a major support level at around $13.52 by April 26th.
Thereafter, the AAL price bounced back and rose by nearly 50% to a high of $19.05, but it could not sustain that level as the sellers were dominant and pushed the AAL price down.
The AAL stock price formed a head and shoulder pattern, which is a bearish sign, and broke down from the pattern’s neckline. The AAL stock has been trading below its 50-day and 20-day moving averages, which are both sloping down, indicating a negative momentum. The AAL stock price has also been making lower highs and lower lows, showing a persistent downtrend. This is a sign of a possible bearish continuation that suggests a drop below the support level.
Based on this analysis, the AAL price action view of the stock is negative and implies that the AAL Stock may continue to fall in the near future unless it breaks above the resistance level and changes the downtrend.
Therefore, if the AAL stock price fails to sustain the current market price level, then it may go downwards and reach the support levels of $15.92 and $13.52.
Alternatively, if the AAL price succeeds in sustaining the CMP level, then it may go upwards and reach the resistance levels of $19.06 and $21.40.
Technical Analysis: AAL Under EMAs
At the time of publishing, American Airlines Group Inc (NASDAQ: AAL) is trading below the 20, and 50-day EMAs (Exponential Moving Average), rejecting American Airlines Group stock price trend. Hence, AAL stock price is expected to move downwards giving bearish signals over the daily time frame chart.
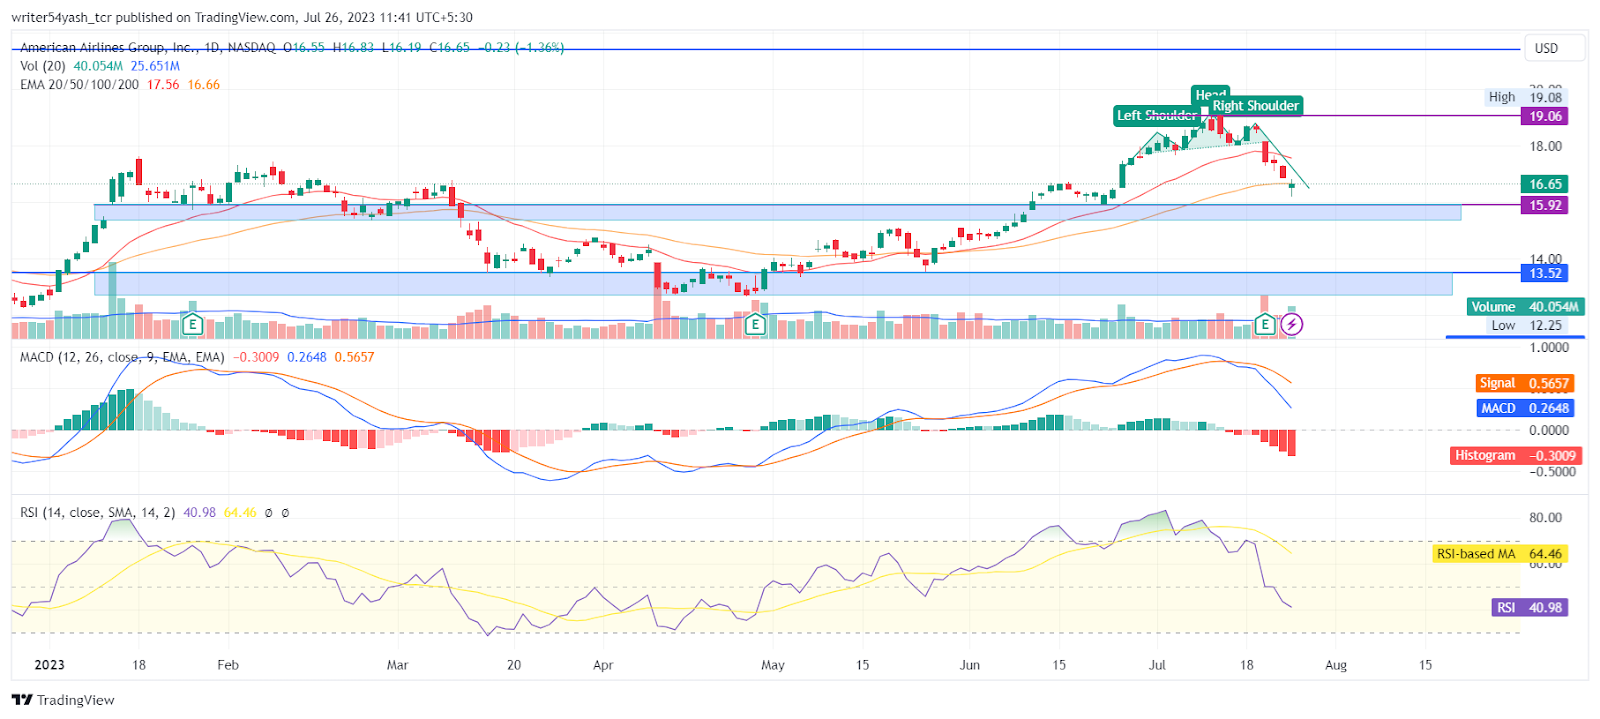
The current value of RSI is 40.98 points. The 14 SMA is above the median line at 64.46 points which indicates that the price is bearish as the RSI line took rejection from the 14 SMA line.
The MACD line at 0.2648 and signal line at 0.5657 are above the zero line and a bearish crossover was observed in the MACD oscillator which signals more bearishness for the AAL share price.
Summary
American Airlines Group Inc. (NASDAQ: AAL) shows that the investors and traders of the stock are bearish on the 1-D time frame. The price action shows a bearish outlook at the time of publishing. The technical parameters of the American Airlines Group stock price also support the bearish trend. The major indicators MACD, RSI, and EMA are giving negative signals and imply that the downtrend may continue in the AAL stock price.
Technical Levels
- Support Levels: The nearest support levels are $15.92 and $13.52.
- Resistance levels: The nearest resistance levels are $19.06 and $21.40.
Disclaimer
In this article, the views and opinions stated by the author, or any people named are for informational purposes only, and they don’t establish the investment, financial, or any other advice. Trading or investing in cryptocurrency assets comes with a risk of financial loss.

With a background in journalism, Ritika Sharma has worked with many reputed media firms focusing on general news such as politics and crime. She joined The Coin Republic as a reporter for crypto, and found a great passion for cryptocurrency, Web3, NFTs and other digital assets. She spends a lot of time researching and delving deeper into these concepts around the clock, and is a strong advocate for women in STEM.


