
 Home
Home News
News
- 1 Render crypto price is trading at $1.79 with an incline of 1.73% in the last 24 hours as per CoinMarketCap (press time).
- 2 RNDR’s current Market Cap is $662.94 Million with FD’s market cap of 962.932 Million.
The all-time high for RNDR is $8.78, and it is currently trading at a drop of -79.60% from the all-time high. Render crypto is the name for the digital currency of the Render Network, a distributed platform that uses GPU power for rendering services. The Render Network allows users to share their GPU resources with other users who need them to create digital content, such as 3D images, motion graphics, visual effects, and more.
Render token reached its peak value of $8.78 on Nov 21, 2021 (Over a year ago). The current value is -78.73% below the highest value ever, and the Render token has fallen by -7.6% in the past week. There has been an increase of +10.10% in the trading volume of RNDR, resulting in $285.522K in the last 24 hours, as per CoinMarketCap.

Render (RNDR) Technical Analysis
RNDR has been making higher highs for a long time resulting in a bullish crossover and an ascending triangle pattern which was recently broken as the market failed to break the higher levels and the market started to drop after making a swing high of $2.9394 and started making new lower lows.
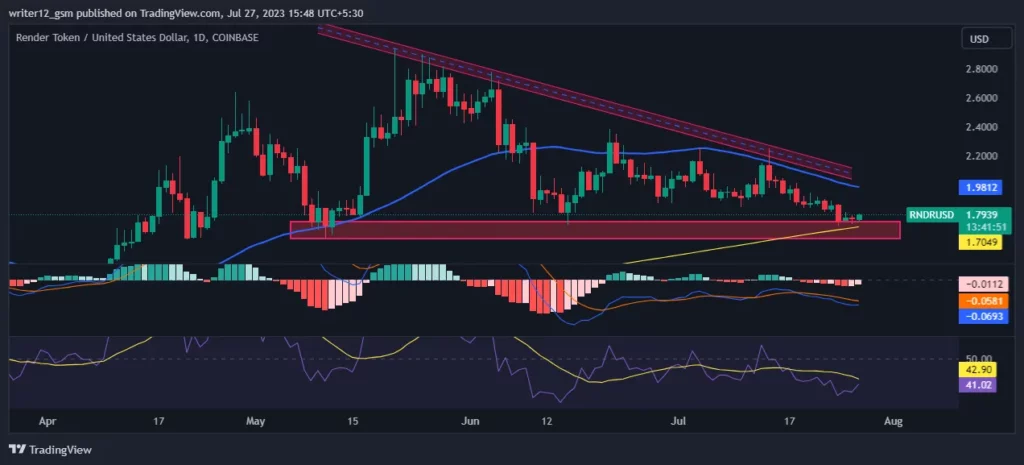
Render recently slipped below the 50 moving average resulting in a downtrend. It is stuck between the 50 and 200 SMAs and is taking support from the 50-moving average. The next move of the crypto depends on whether it bounces back or breaks down from the 200-day moving average.
The RSI is heading towards oversold territory. The RSI value is 41,28. The 14 SMA value is 42.92, which means that the RENDER price is bearish and is giving bearish signs.
Currently, MACD is showing a bearish sign. The MACD value is -0.0691, and the signal value is 0.0581, and both are heading below the zero line, indicating that the MACD is giving bearish signals for now.
Conclusion
Render is in a bearish trend and is facing downward pressure. It is trapped between the 50 and 200 SMA and is testing the support of the 200 moving average. The RSI and MACD are giving bearish signals and heading towards the oversold and negative zones, respectively. Render may continue to decline if it breaks below the 200 moving average. The major indicators like RSI and MACD are pessimistic about the stock. Ford stock is crucial, so investors and traders should wait for proper setup for the next move and avoid FOMO.
Technical Levels
- Support Level – The current support level is 1.6063.
- Resistance Level – The current resistance level is 2.3067
Disclaimer
The information in this article, including the views and opinions expressed by the author or any individuals mentioned, is intended for informational purposes only. It is important to note that the article does not provide financial or investment advice. Investing or trading in cryptocurrency assets carries inherent risks and can result in financial loss.

Andrew is a blockchain developer who developed his interest in cryptocurrencies while pursuing his post-graduation major in blockchain development. He is a keen observer of details and shares his passion for writing, along with coding. His backend knowledge about blockchain helps him give a unique perspective to his writing skills, and a reliable craft at explaining the concepts such as blockchain programming, languages and token minting. He also frequently shares technical details and performance indicators of ICOs and IDOs.


