
 Home
Home News
News

- 1 Amazon’s stock price shed 4.34% over the last week.
- 2 The Amazon.com, Inc. ( NASDAQ: AMZN ) stock’s 52-week price range is $81 – $146.
Amazon stock saw a 9.6% per year increase in earnings, on average, as reported by Simply Wall St., a website that provides financial information. The earnings of the Multiline Retail industry grew by 14.8% per year, while the company’s revenues have also been rising by 20.5% per year on average. Amazon.com has a return on equity of 2.8% and a net margin of 0.8%.
Amazon stock has a debt-to-equity ratio of 60.1%, as stated by Simply Wall St. The ratio is calculated from its total shareholder equity of $154.5 Billion and total debt of $92.9 Billion. The company’s total assets are $464.4 Billion and its total liabilities are $309.9 Billion. Amazon.com’s interest coverage ratio is 10.9, which is derived from its EBIT of $13.3 Billion. The company has $64.4 Billion in cash and short-term investments.

The market capitalization of AMZN stock is $1.316 Trillion and the total revenue is $513.98 Billion. Moreover, the stock’s basic EPS is $0.42 and the price-to-earnings ratio is 310.89. Moreover, the average volume is 200.459K and the current volume is 533.785K, the current volume is above average volume.
Moreover, the stock has not done well this month, decreasing by 0.30% but it has surged by 28.86% in the last six months. Amazon.com Inc. (NASDAQ: AMZN) stock has a positive year-to-date return of 50.07% and also a positive 1-year return of 9.33%.
Technical Analysis of Amazon Stock in 1-D Timeframe
The Amazon stock price (NASDAQ: AMZN), at the time of writing, is trading at $128.25. Previously, a bullish pattern emerged that gave a breakout and AMZN entered an uptrend by making higher highs and higher lows.
However, the candles are smaller on the daily chart and the volume is also lower, which signaled a loss of momentum earlier. By July 19th, the stock pulled back from resistance, which was expected as the trend lost steam in the long upward rally and the price dropped.
Amazon stock price is trying to sustain at the higher levels. Moreover, the price had increased earlier by 30% without any retracement, which suggested earlier that a correction was required in the stock to resume upwards. It was a correction in the price by taking a pullback in price. Now, the stock needs more buyers to gain momentum or the correction might continue.
Therefore, if the Amazon stock price holds the CMP level, then the price may go up and reach the targets of $138.28 and $144.69.
However, if the Amazon stock price is rejected from the CMP level and falls, then it may reach the nearest support levels of $118.78 and $113.87.
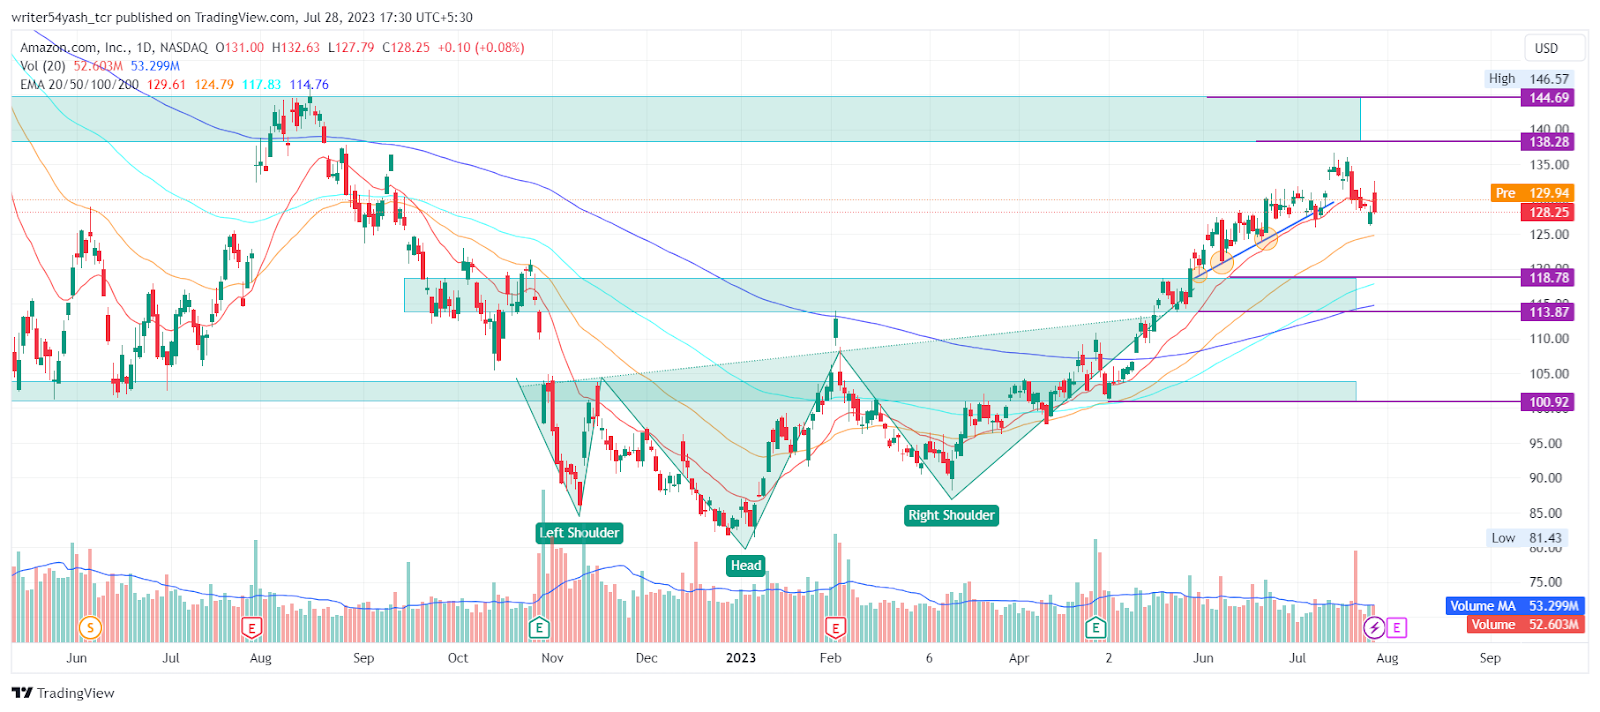
At the time of publishing, the price of Amazon.com, Inc. (NASDAQ: AMZN) is above the major EMAs (20, 50, 100, and 200-day exponential moving averages), which are backing the AMZN price trend. However, the price is near the 20 EMA, which could be breached if profit-booking happens. Therefore, the Amazon stock price is expected to go up until the profit-booking happens. If profit-booking occurs, then the outlook on the daily time frame chart may turn bearish.
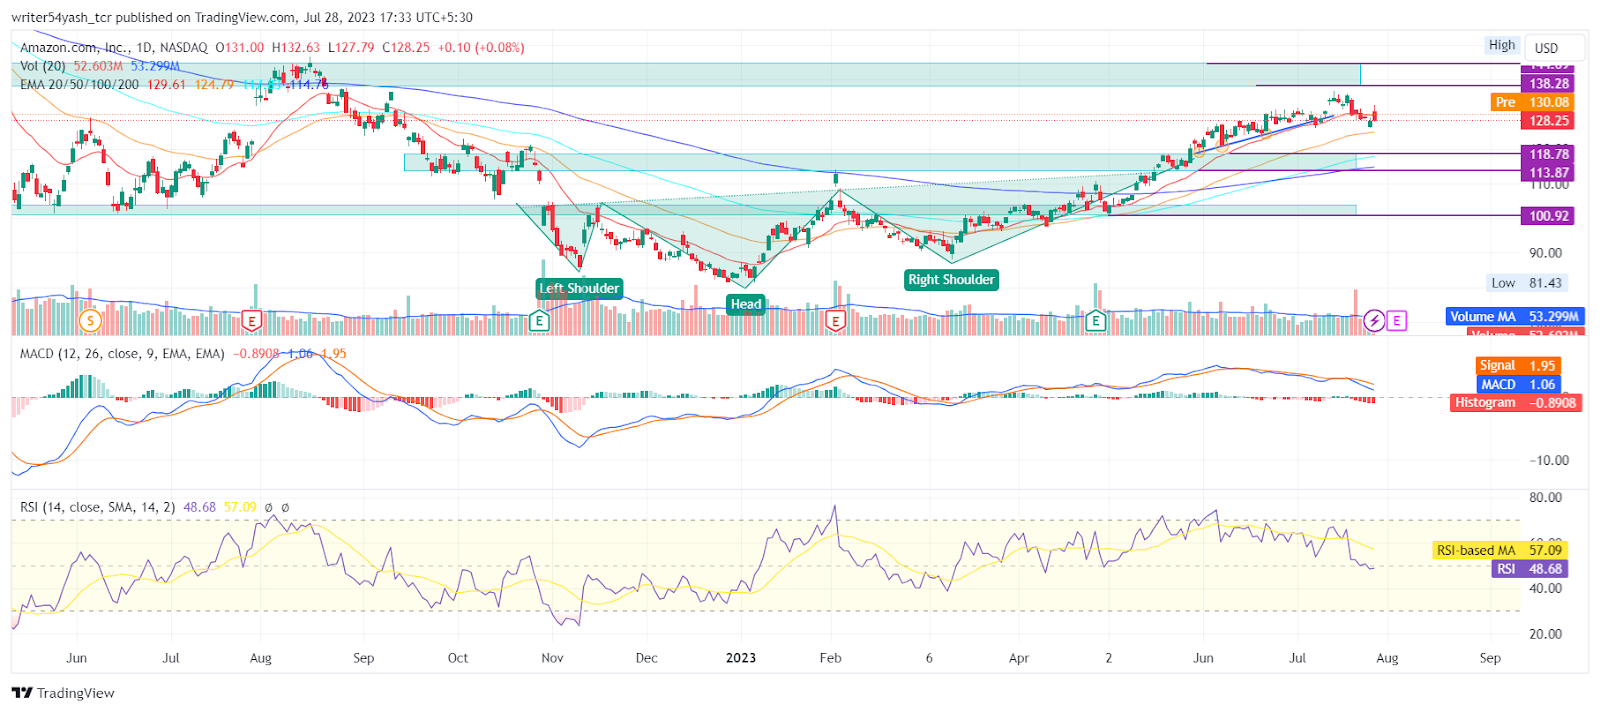
The MACD line at 1.06 and signal line at 1.95 are above the zero line and gave a bearish crossover, indicating bearish signals and may begin a new downtrend. The current value of RSI is 48.68 points as it faced rejection from the 14 SMA line. The 14 SMA is above the median line of 57.09 points which shows a good opportunity towards the oversold territory.
Summary
Amazon stock price prediction shows that the AMZN stock investors and traders are bearish in the 1D time frame. The technical factors of the stock indicate the upcoming downtrend on the daily time frame chart. Furthermore, the AMZN stock is showing signs of bearishness as major indicators MACD and RSI are giving negative signals and are opposing the price, giving bearish outlooks. Therefore, it may be considered as a bearish view for the next few weeks from the day of writing on the daily time frame.
Technical Levels:
- The nearest support: $118.78 and $113.87.
- The nearest resistance: $138.28 and $144.69.
Disclaimer
In this article, the views and opinions stated by the author, or any people named are for informational purposes only, and they don’t establish the investment, financial, or any other advice. Trading or investing in cryptocurrency assets comes with a risk of financial loss.
Steve Anderson is an Australian crypto enthusiast. He is a specialist in management and trading for over 5 years. Steve has worked as a crypto trader, he loves learning about decentralisation, understanding the true potential of the blockchain.


