
 Home
Home News
News
- 1 ADA price has been hovering near the crucial range of $0.3000 over the past sessions.
- 2 Buyers cannot bring their strength and lose the gains continuously.
Cardano (ADA) price shows a lack of strength, it has been consolidating near the round mark of $0.3000 for the past few months. However, the price rebounded from the lows of $0.2500, forming a symmetrical triangle pattern on the charts. Moreover, the price action does not show any bullish cues due to the sellers’ dominance, indicating further bearishness.
Moreover, if the ADA price breaks below $0.3000, it will retest $0.2500 once again. The charts signal bearishness, and trading near the 20-days EMA shows that sellers persisted in making shorts and buyers unwinding their positions. ADA coin price continues in correction from the top and losing the gains for the past months. During the start of 2023, ADA was investors’ favorite as regular buying was witnessed. Afterwards, from the highs of $0.4500, buyers could not sustain on the top and will gradually sink toward the low of $0.2500.
The price action shows that ADA tried to surpass the 200-days EMA but failed multiple times. Moreover, sellers’ are in good numbers, putting the bulls under pressure. As per the technicals, ADA price trading is on the verge of the 20-day EMA; a free fall can be seen if a breakdown happens.
At press time, ADA price is trading at $0.3096 with an intraday drop of 0.40% showing sellers’ dominance on the charts. Moreover, the trading volume at $259.14 Million is average. The pair of ADA/BTC is at 0.0000016 BTC. The market cap of ADA is $10.84 Billion.
Cardano (ADA) Shows Sellers Attainability As Per Price Action On Daily Charts
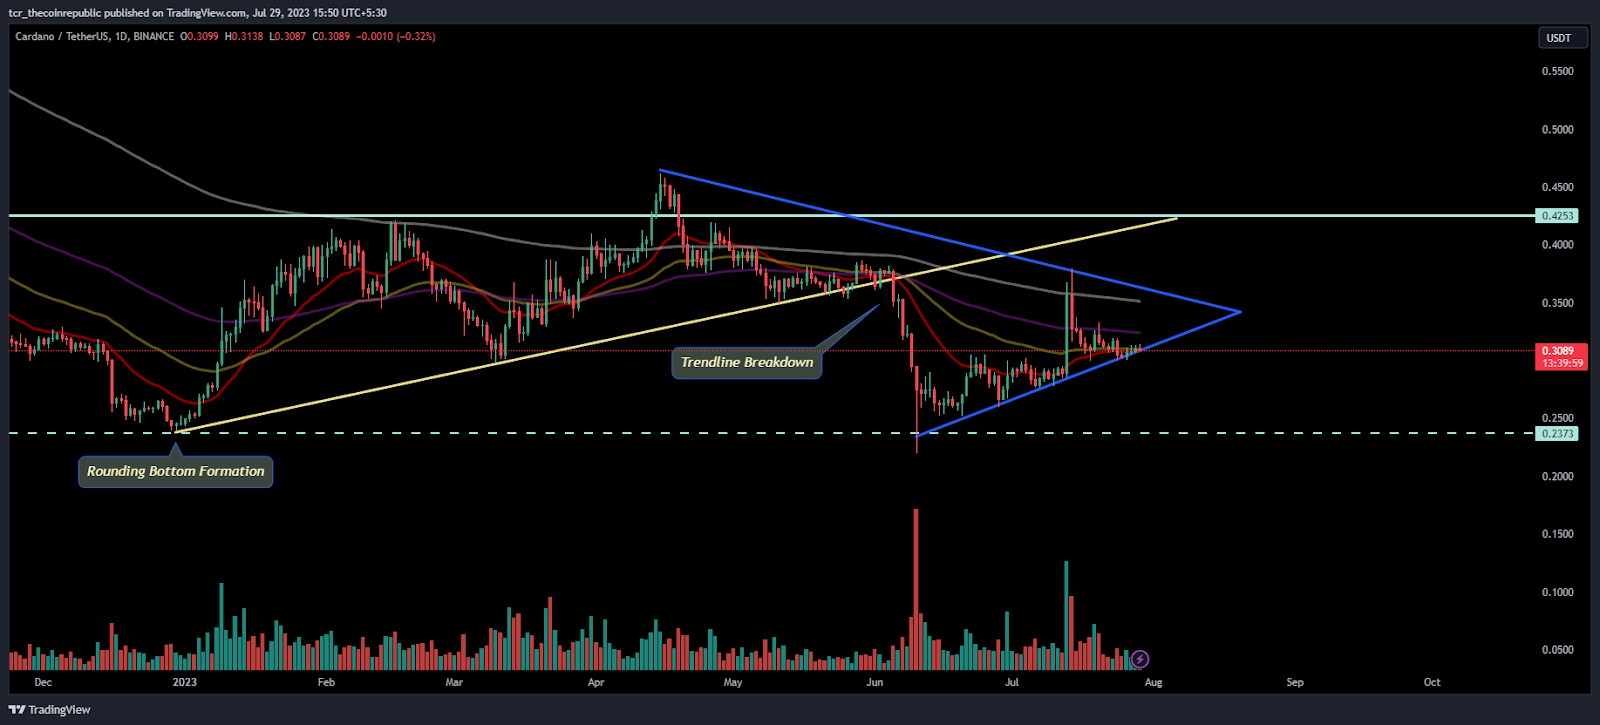
The daily chart shows that ADA price is below neutrality, indicating that there was selling pressure in the past sessions. Moreover, the price is trading at a make-or-break level, where further breakdown happens, and intense selling is visible. However, buyers respected the lower trendline and continued holding gains inside the symmetrical triangle pattern.
As per the Fib levels, ADA price is trading above 23.6% but below 38.2% and trying to hold that range. Moreover, the price trades below the mid bollinger band and indicates negative sentiments for the past months.
Short Term Charts Show Range Bound Move
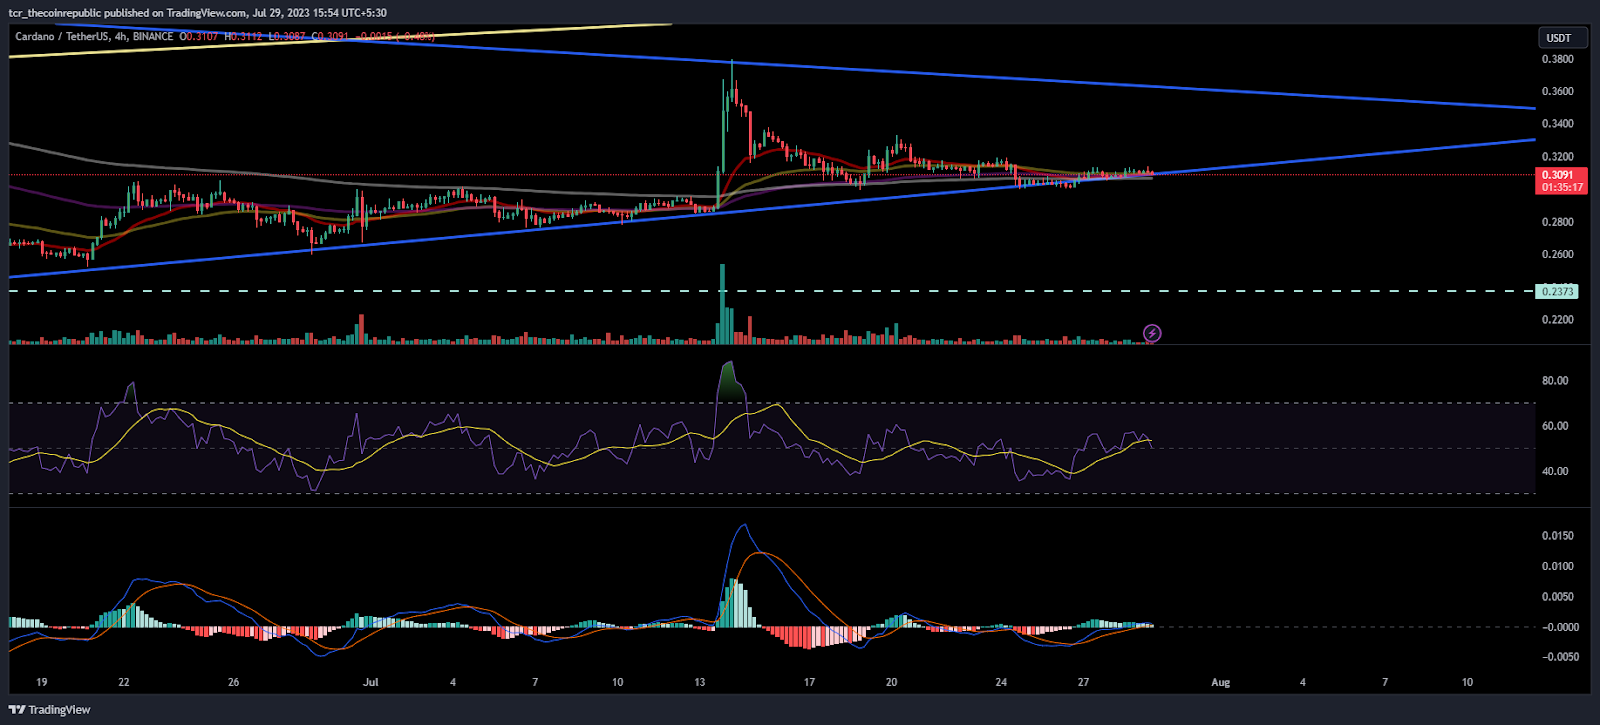
On the 4-hour charts, ADA price is trading in a narrow range, and buyers are willing to break the neckline of $0.3100. On the other hand, a descending triangle pattern was noted, signalling that a breakdown will be registered below $0.3000.
The RSI curve stayed near the neutrality of 52, maintaining the gains near the 20-day EMA. Moreover, buyers seem cautious and look like they have held onto the range tightly.
The MACD indicator showed a bullish crossover, and buyers are holding the range decisively and trying to escape the neckline soon.
Conclusion
Cardano (ADA) price trades near the 20-days EMA, showing sellers’ dominance in the past sessions. However, buyers hold the lower trendline and maintain the gains near the round mark of $0.3000.
Technical Levels:
Support Levels: $0.2800
Resistance Levels:$0.3200
Disclaimer
The views and opinions stated by the author, or any people named in this article, are for informational purposes only and do not establish financial, investment, or other advice. Investing in or trading crypto assets comes with a risk of financial loss.

Nancy J. Allen is a crypto enthusiast, with a major in macroeconomics and minor in business statistics. She believes that cryptocurrencies inspire people to be their own banks, and step aside from traditional monetary exchange systems. She is also intrigued by blockchain technology and its functioning. She frequently researches, and posts content on the top altcoins, their theoretical working principles and technical price predictions.


