
 Home
Home News
News
- 1 Accenture price increased by 0.75% over the past seven days.
- 2 Accenture PLC (NYSE: ACN) stock’s 52-week price range is $261 – $327.
Accenture stock’s earnings have increased by 12% annually on average, according to a financial website, Simply Wall St, that provides analysis and insights on stocks. This is lower than the 22.1% annual growth rate of the IT industry, indicating that Accenture is underperforming its peers. The company’s revenues have also risen by 10.2% per year on average, which reflects its solid performance. Accenture stock’s return on equity is 28%, and it has net margins of 11.3%.
Accenture stock has a strong financial position, as reported by Simply Wall St. Its shareholder equity, which is the difference between its assets and liabilities, is $26.1 Billion. Its debt level is very low, only $54.3 Million, which means its debt-to-equity ratio is only 0.2%. This shows that it relies mostly on its own funds rather than borrowing. Its EBIT, which is its earnings before interest and taxes, is $9.8 Billion. This means it can easily cover its interest expenses, which are negative because its interest income is higher than its interest cost. Its interest coverage ratio is -62.2. It also has a large amount of cash and short-term investments, $8.5 Billion, which gives it liquidity and flexibility.
The market capitalization of ACN stock is $209.624 Billion and the total revenue is $61.594 Billion. Moreover, the stock’s basic EPS is $11.35 and the price-to-earnings ratio is 28.41. Moreover, the average volume is 1.902 million and the current volume is 1.921 million, the current volume is above average volume.
Moreover, the ACN stock has done well this month, increased by 4.69%, and surged by 15.35% in the last six months. Accenture Plc (NYSE: ACN) stock has a positive year-to-date return of 17.22% and also a positive 1-year return of 3.62%.
Technical Analysis of Accenture Price in 1-D Time Frame
The price action shows that Accenture Plc’s ( NYSE: ACN) price has shown a bullish trend for the last three months, rising by 15.28%. At the time of publication, ACN price is trading at $315.55 and forming a symmetrical triangle in the one-day time frame. This pattern indicates that the ACN price is consolidating and will soon choose a direction, which could be either up or down.
Therefore, if the ACN price holds the current level, it could move upwards and reach the first and second targets of $329.09 and $342.69. However, if the ACN price rejects the current level and drops, then it might hit the nearest support levels of $294.93 and $285.56.
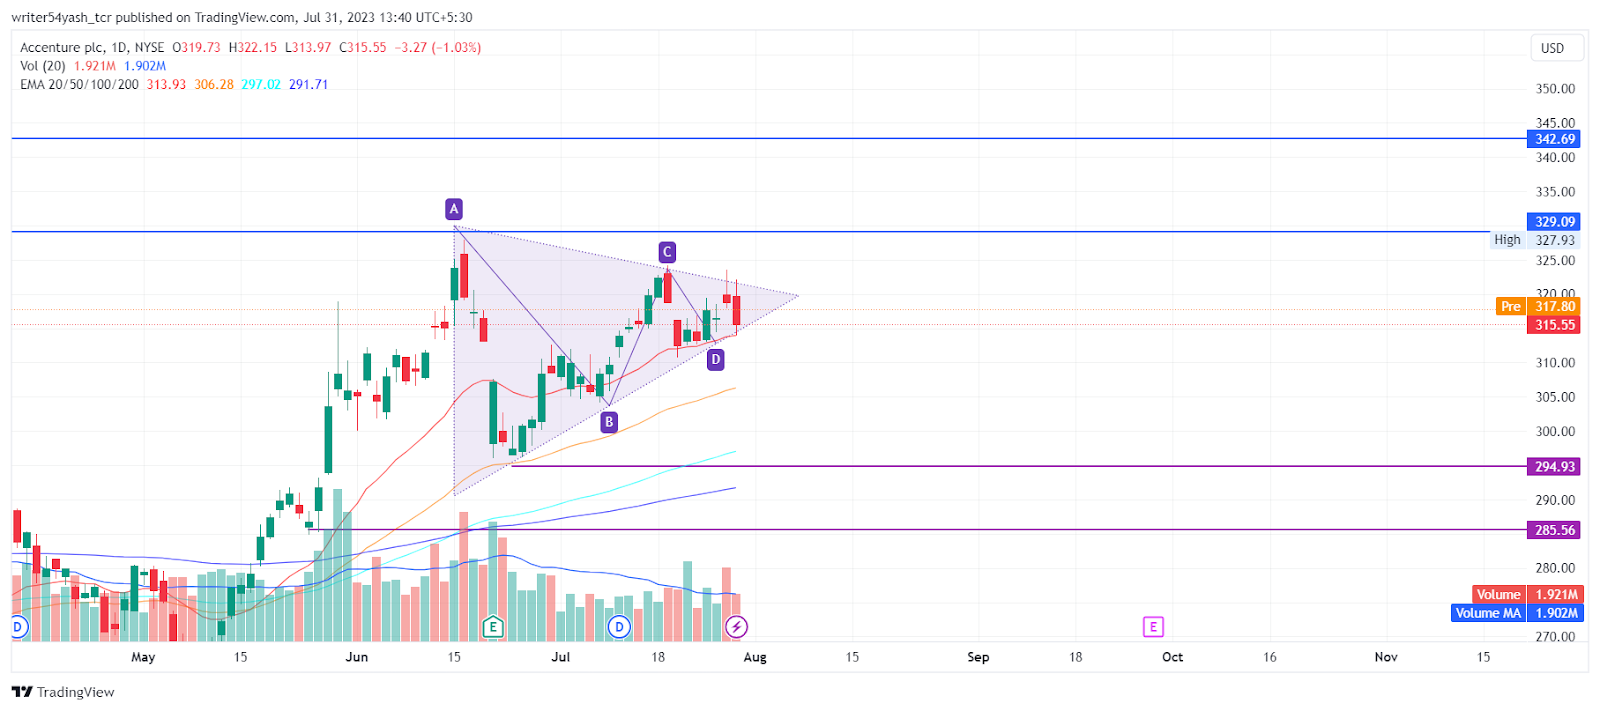
At the time of publishing, Accenture Plc. is trading above the 20, 50, 100, and 200-day EMAs (exponential moving average), which supports the Accenture stock price trend. However, the price took a pullback in the last couple of days and the price seems declining. Moreover, if ACN price fails to sustain then the price might decline by breaking major EMA’s one by one over the daily time frame chart.
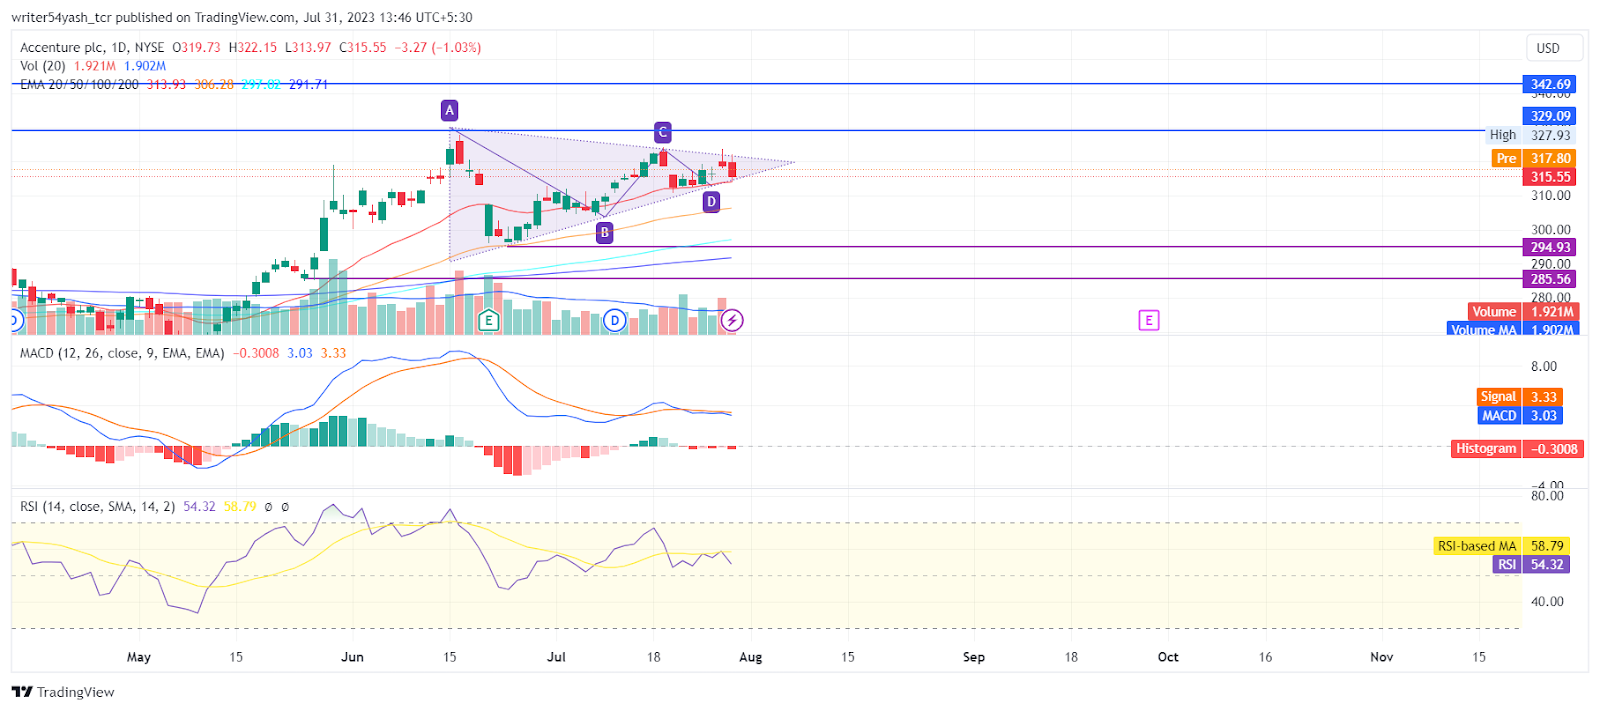
The current value of RSI is 54.32 points. The 14 SMA is above the median line at 58.79 points which indicates bearishness that the price has changed direction and declining by taking rejection from 14SMA.
The MACD line at 3.03 and signal line at 3.33 are above the zero line and a bearish crossover was observed in the MACD oscillator which signals more bearishness for the ACN stock price.
Summary
Accenture Plc. (NYSE: ACN) shows that the investors and traders of the stock are bearish on the 1-D time frame. The price action reflects a bearish outlook at the time of publishing. The technical parameters of the ACN stock price also support the bearish trend. The major indicators MACD, RSI, and EMA are giving negative signals and imply that the downtrend may continue in ACN stock price.
Technical Levels
- Support Levels: The nearest support levels are $294.93 and $285.56.
- Resistance Levels: The nearest resistance levels are $329.09 and $342.69.
Disclaimer
In this article, the views and opinions stated by the author, or any people named are for informational purposes only, and they don’t establish the investment, financial, or any other advice. Trading or investing in cryptocurrency assets comes with a risk of financial loss.
Mr. Pratik chadhokar is an Indian Forex, Cryptocurrencies and Financial Market Advisor and analyst with a background in IT and Financial market Strategist. He specialises in market strategies and technical analysis and has spent over a year as a financial markets contributor and observer. He possesses strong technical analytical skills and is well known for his entertaining and informative analysis of the Financial markets.


