
 Home
Home News
News
- 1 Starbucks stock price (NASDAQ: SBUX) recovered 6% (approx.) from the recent swing low.
- 2 SBUX stock price succeeded to climb above the 50-day EMA and 200-day EMA.
- 3 Starbucks Corp scheduled the quarterly earnings on August 1, 2023.
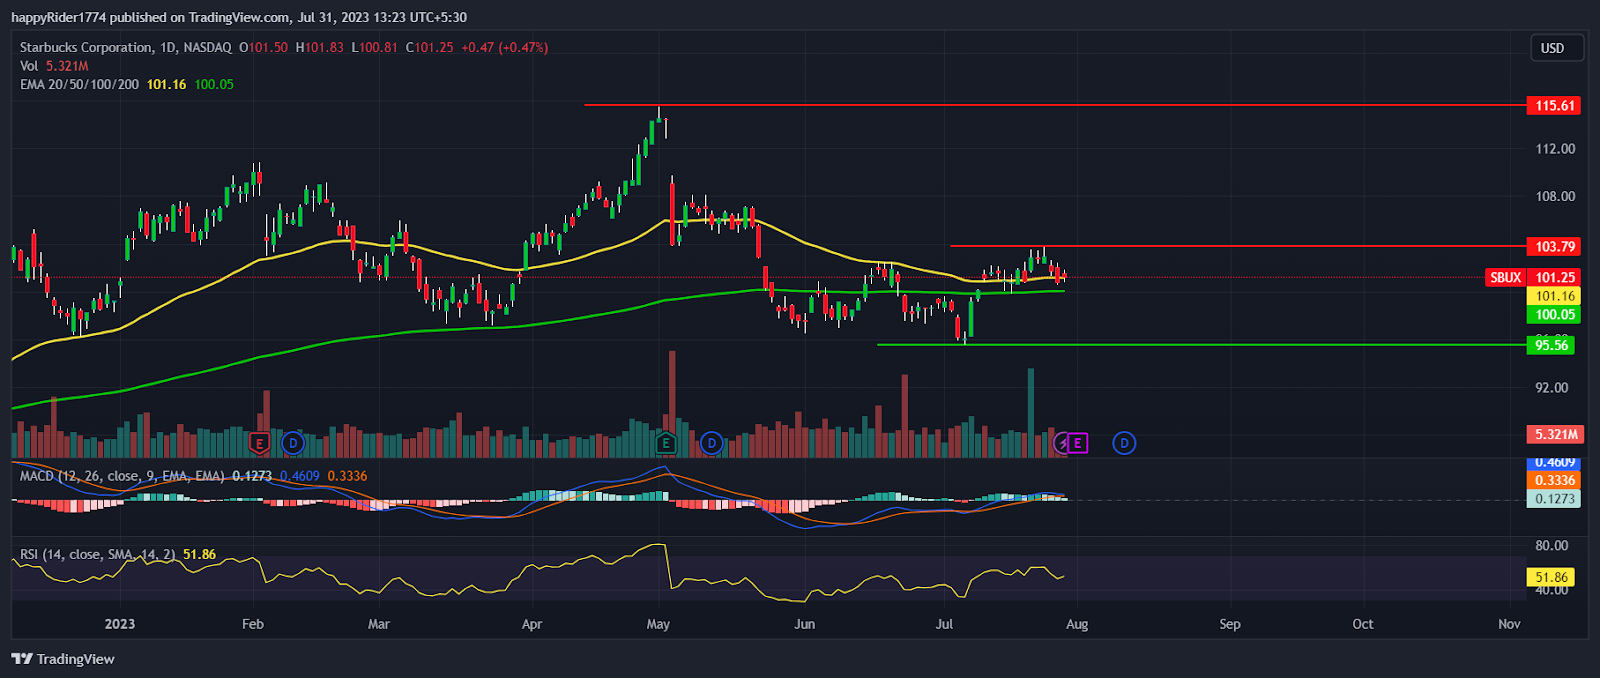
Starbucks stock price (NASDAQ: SBUX) recovered 6% (approx.) from the recent swing low and regained the $100.00 mark. SBUX stock price formed a double bottom pattern which showed the sign of a bullish trend reversal.
SBUX stock price managed to climb above the 50-day and 200-day EMA indicating bulls are returning back to track. However, both the EMAs are sloping sideways showing prices might spend some time in consolidation.
For the past few months, Starbucks stock price has been in a short-term downtrend. It corrected 16% from its 52-week high. The correction took a halt near $95.00 and prices showed a minor bounce.
Meanwhile, the sudden spike in the buying volume is also visible. It indicates some genuine buyers are accumulating and expecting outperformance in the coming months.
Starbucks Corp quarterly earnings are scheduled in the current week due to which the volatility may increase. The stock prices might show the next direction after the release of quarterly earnings.
Starbucks stock price closed the previous session at $101.25 with an intraday rise of 0.47%. The market capitalization stands at $116.07 Billion.
Will Starbucks Stock Continue the Recovery after Earnings?
Starbucks stock price (NASDAQ: SBUX) seems to be consolidating in the narrow range between $95.00 to $103.00. If the prices continue to consolidate for a few more months then it can be considered as base formation.
Starbucks Corp is expected to release earnings on August 1, 2023, after the bell. Equity analysts estimate an EPS of 0.952 and Revenue of $9.292 Billion.
After analyzing the past earnings, the company might beat the estimates which will positively impact the stock prices. However, if Starbucks Corp disappoints in earnings then Bears might try to pull the stock below $100.00.
SBUX Stock Price Analysis on Weekly Time Frame
SBUX stock price formed a bullish candle on the weekly time frame but buyers failed to give the follow-up momentum. The probability of upward range expansion will increase if quarterly earnings are better than expected.
The MACD curve is sustaining above the zero line and the histogram bar is also green. It indicates mild bullishness. The RSI at 51 denotes neutral territory and an equal level of tug-of-war between buyers and sellers.
Conclusion
Starbucks stock price (NASDAQ: SBUX) holds $100.00 and buyers are trying their best to continue the recovery. The technical analysis suggests SBUX stock is mildly bullish and buyers seem to be returning back to track.
Technical levels
- Resistance levels: $104.00 and $110.00
- Support levels: $95.00 and $93.00
Disclaimer
The views and opinions stated by the author, or any people named in this article, are for informational purposes only. They do not establish financial, investment, or other advice. Investing in or trading crypto assets comes with a risk of financial loss.
Steve Anderson is an Australian crypto enthusiast. He is a specialist in management and trading for over 5 years. Steve has worked as a crypto trader, he loves learning about decentralisation, understanding the true potential of the blockchain.


