
 Home
Home News
News
- 1 The Visa Inc. stock price is trading at $235.75 currently with a market capitalization of $480.592 Billion (press time).
- 2 V stock gave more than 12.65% return to investors year-to-date.
V stock is a US-based global financial services company that offers digital payment solutions for people, businesses, financial institutions, governments, and merchants. It facilitates electronic funds transfers through Visa-branded credit cards, debit cards, prepaid cards, and other payment products. It is listed on the New York Stock Exchange (NYSE) with the ticker symbol V.

Visa stock is trading at $235.75, down by 0.56 or 0.22% from the previous close. Visa stock has a 52-week range of $174.60 to $245.37. Visa has a market value of $480.592 Billion. Visa has a P/E ratio of 31.34 and an EPS of $7.48. Visa pays a dividend of 0.77%. These numbers indicate Visa is a profitable and stable company with a strong position in the digital payment industry.

On the weekly chart, V stock price has broken above the 50 and 200-day moving averages, showing the strength of the bulls. V stock price has proven that the market is positive. Furthermore, the relative strength index (RSI) and (moving average convergence divergence) MACD are also bullish on the weekly chart.
V Stock Price Technical Analysis
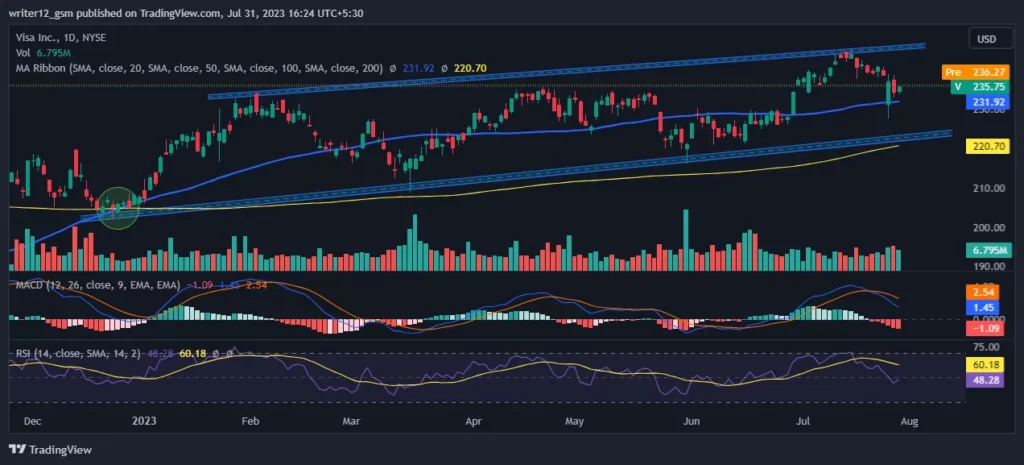
Currently, MACD is in the bullish area. The MACD value is 1.45 and the signal value is 2.45, and both are heading downward. This means the bullish momentum is fading, and a bearish crossover might happen soon. The MACD and the signal line are also below the zero line, signaling a negative trend.
The RSI is nearing the oversold zone. The RSI value is 48.28, which is close to the 50 level, indicating a balanced market. The 14 SMA value is 60.18, which means that the Visa stock price is neutral as of now. The RSI and the SMA are diverging, indicating a potential reversal in the near future.
The Bollinger Bands for V stock have an upper band of $244.52, a middle band of $239.47, and a lower band of $234.42. The stock’s price is above the middle band, indicating a neutral trend. However, the price is also near the upper band, which implies the stock is overbought and may encounter resistance. The Bollinger Bands are also narrowing, suggesting lower volatility and a possible breakout.
Conclusion
Visa Inc. stock has shown impressive performance and momentum. The stock is reaching new highs and surpassing the 50- and 200-day moving averages on both the daily and weekly charts. The price, RSI, and MACD are all bullish, indicating a strong uptrend and a positive outlook. However, traders and investors should wait for an ideal setup and avoid FOMO.
Technical Levels:
- Support – The current support level is $220.00.
- Resistance –The current resistance level is $245.00.
Disclaimer
The prediction given in this article is for informational and educational use only. Do not use this information as financial, investment, or as trading advice. Investing and trading in stock is a risky task. Please consider your circumstances and risk profile before making any investment decisions.

Andrew is a blockchain developer who developed his interest in cryptocurrencies while pursuing his post-graduation major in blockchain development. He is a keen observer of details and shares his passion for writing, along with coding. His backend knowledge about blockchain helps him give a unique perspective to his writing skills, and a reliable craft at explaining the concepts such as blockchain programming, languages and token minting. He also frequently shares technical details and performance indicators of ICOs and IDOs.


