


Vermilion Energy is a company that explores and produces oil and gas in various countries. It has land holdings in Canada, the US, France, the Netherlands, Germany, Croatia, Hungary, and Slovakia.
Vermilion Energy’s share price is currently trading at $13.59, inclining 3.03% in the last trading session. VET stock holds a market cap of $2.2 Billion. It has a total of 164.7 Million shares outstanding. The PE ratio for the stock is 2.1. It has annual sales of $2,627 Million.
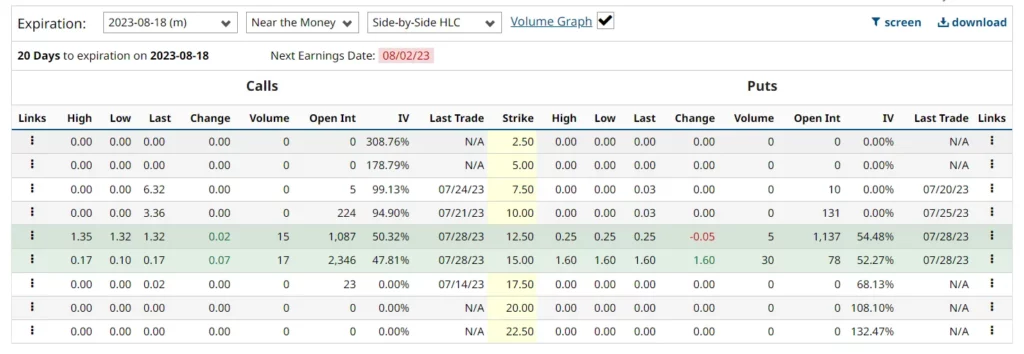
VET stock derivatives data states that the current Implied volatility in the market is 47.32% with an increment of 0.69% in the last trading session. It has a total of 90.08K open interest contracts as of now. The PUT/CALL ratio is 0.25 indicating a bearish sentiment coming to an end as PCR is bottoming out.
VET Stock Price Prediction Using Price Action Strategy
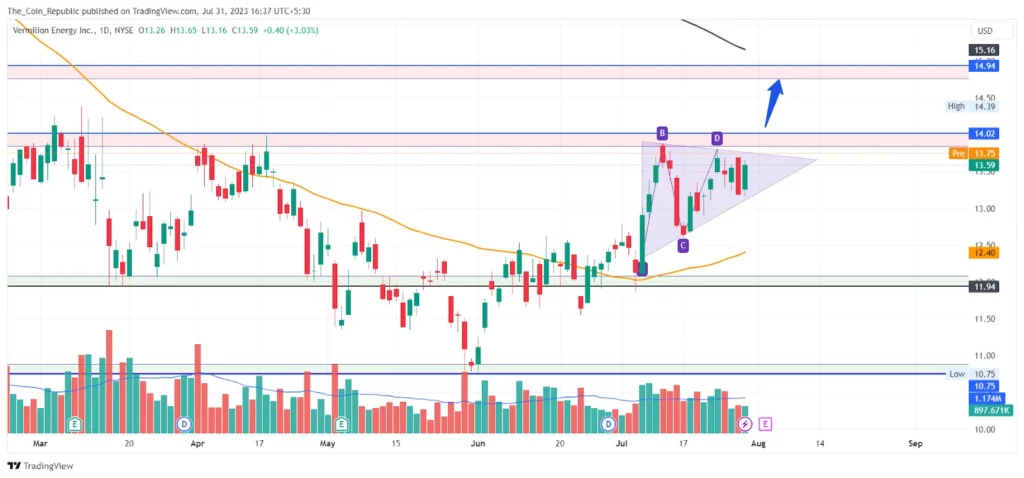
VET share price analysis reveals that the stock was in a correction phase and declined nearly 40% from January to May 2023, thus forming a new swing low of $10.80. Thereafter the price got the support of buyers and surged nearly 25% to change its character from bearish to bullish.
Thereafter, the price made a dip again but ended up forming a new lower high and surged to the previous high. Currently, the price is trying to sustain near the swing high and forming a triangle pattern.
Now, if the price breaks and sustains above the swing high, it may attract more buyers to enter into a trade and surge higher. Also, the price may surge as the result days are nearing.
VET Share Price Forecast from Indicators’ point of view
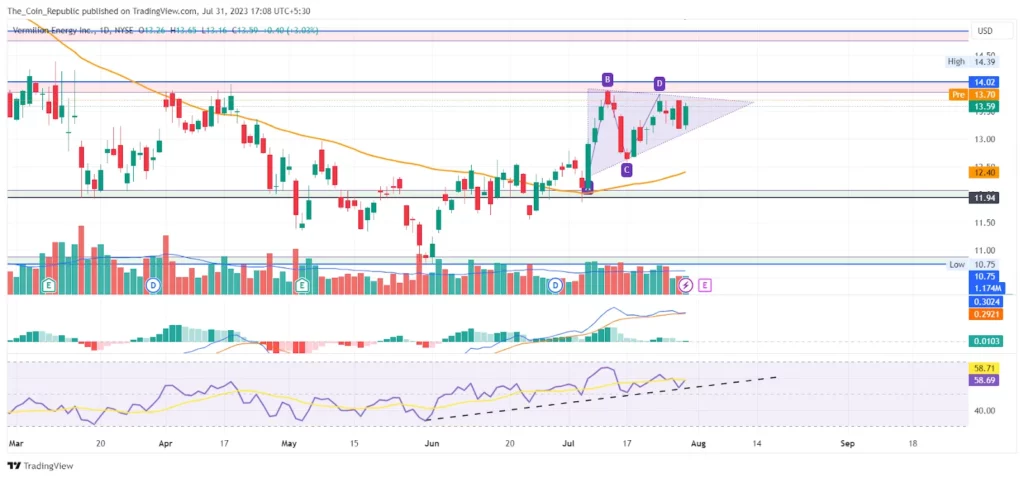
As per the EMA analysis, the VET stock price is trading above 50 EMA and surged higher after getting support which indicates the short-term presence of buyers in the market. Also, the price needs to surpass the hurdle of 200 EMA to surge higher.
At the time of publishing, the RSI value of the VET share price is 58.69 and that of the SMA line is 58.71. RSI is headed upwards by getting support from the SMA line which shows the short-term presence of buyers in the market.
Conclusion
VET stock price prediction concludes that the stock was in a correction phase and declined 40% from January to May 2023. Thereafter the price got buyer’s interest and surged nearly 20% thus changing its character. Currently, the price is trying to sustain near the swing high after the breakout of which the price may surge higher. The indicators are also leaving a positive note about the current sentiment in the market. Also, the results are awaiting which may affect the price to surge higher before the disclosure of the results.
Technical Levels
- Support levels: $11.94 and $10.75.
- Resistance levels: $14.02 and $14.94.


