
 Home
Home News
News
- 1 Alibaba (BABA) stock price secured its place at second place in 1D volume activity in internet retail industry stock.
- 2 Out of 49 internet retail stocks in the U.S., Alibaba stock noted over 17 Million volume in 1D.
Alibaba Group (NYSE: BABA) stock price started this week with a bullish trend by gaining a 1.60% price rise. By indicating a “strong buy” technical rating to BABA stock, its volume reached 17.724 Million in one day (1D). Ahead of Alibaba stock, Amazon.com, Inc. (NASDAQ: AMZN) reserved its first position with 41.901 Million of volume in 1D.


As the above chart shows, JD.Com Inc. (NASDAQ: JD) and Farfetch Ltd (NYSE: FTCH) experienced over 12 Million and 9 Million of volume in 1D.

Will BABA Stock Continue its One-Month Trend?
In the recent month, Alibaba stock rose over 22% with quite a good upward trend. By trading near the price of $86.00, BABA stock price surpassed the trading price range of $100.00. This price rise was noted in the recent 1-month which reached its overbought zone now, as per the data sourced from TradingView, a web-based social network for traders.
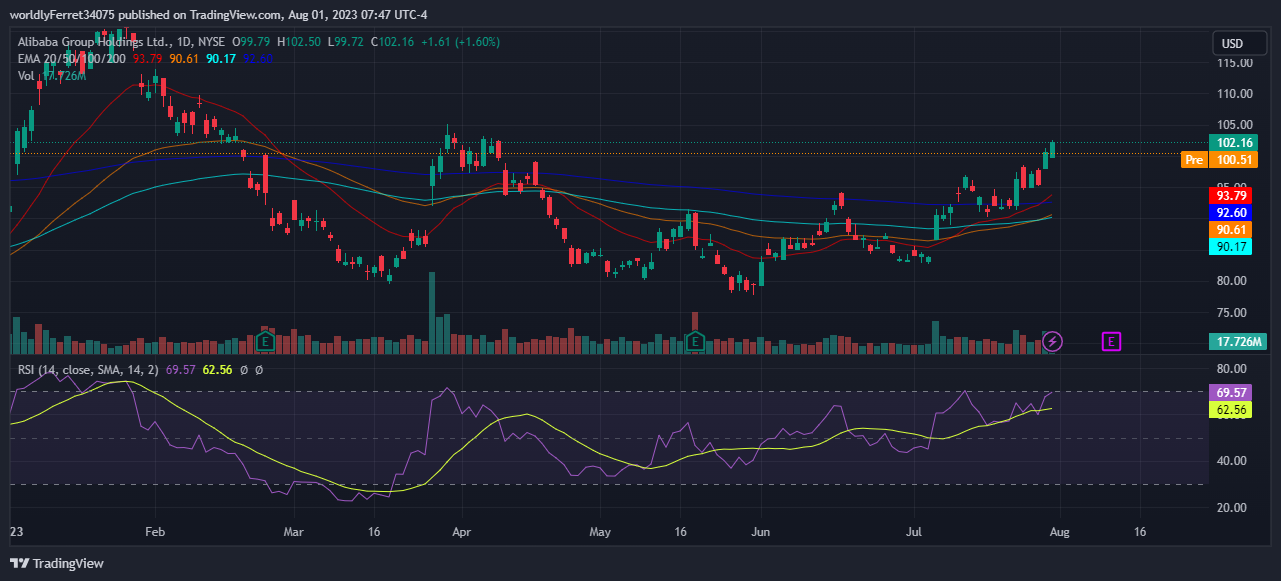
At press time, the pre-market price of BABA stock is resting at $100.51, showing a slight decline from the recent closing price of the stock. As on July 31, 2023, Monday, BABA stock price noted closing at $102.16, whereas its opening price was at $99.79. The trading price range of the stock was between $102.50 to $99.72 on Monday.
Notably, in the upcoming week, Alibaba Group Holding Ltd will release its Q1 2023 report. Near that, the bullish trend in BABA share price is quite positive. Additionally, in the last month, BABA share price performed bullishly, and if a similar trend is followed by the stock price, then bullish continuity can be expected ahead of Q1 2023 earnings and revenue report.
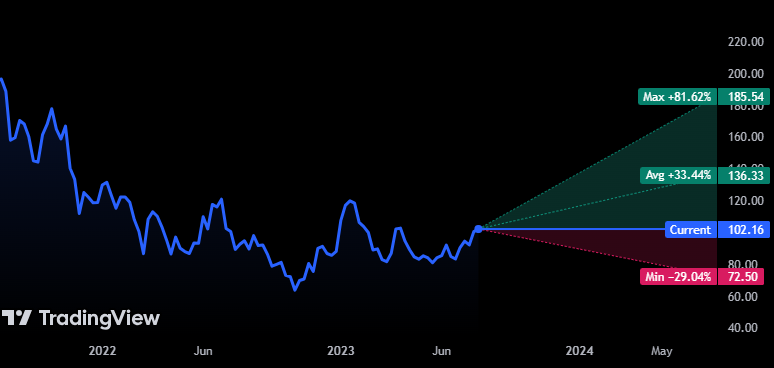
The analysts have set their one-year price target at $136.33 which is up over 33% from the recent closing price of the stock. The maximum price target set by the analysts is showing at $185.54 while the minimum estimate is $72.50. In the past three months, analysts have given a “strong-buy” rating to Alibaba Group Holdings Ltd.
The Financial Highlights of Alibaba Group
Alibaba Group Holding Ltd (NYSE: BABA), a Chinese multinational technology company, has a market cap of nearly $254.64 Billion. BABA’s price-to-sales ratio is 2.07 and the company has an Enterprise Value to EBITDA ratio of 10.36.
According to its Q4 2022 report, its net income is $3.44 Billion. Its earnings per share (EPS) for the quarter is $1.56 whereas the estimation was $1.37 which accounts for a 13.44% surprise. The revenue for the same period amounts to $30.31 Billion despite the estimated figure of $30.38 Billion.
For Q1 2023, the estimated EPS is $2.01, and revenue is expected to reach $30.93 Billion.
Disclaimer
The views and opinions stated by the author, or any people named in this article, are for informational ideas only and do not establish financial, investment, or other advice. Investing in or trading crypto or stock comes with a risk of financial loss.
Steve Anderson is an Australian crypto enthusiast. He is a specialist in management and trading for over 5 years. Steve has worked as a crypto trader, he loves learning about decentralisation, understanding the true potential of the blockchain.


