
 Home
Home News
News
- 1 WDAY stock price surged 0.91% in the last trading session and is currently trading at $237.13.
- 2 Workday share price (NYSE: WDAY) has good value based on its price-to-sales ratio (9.6x) compared to the peer average (11.9x).
Workday is a company that provides cloud applications for businesses. Its applications help customers plan, execute, analyze, and extend their operations. The company has a financial management suite to help CFOs manage accounting, payables, receivables, consolidation, reporting, and auditing.
Workday’s share price is currently trading at $237.13, inclining 0.91% in the last trading session. WDAY stock holds a market cap of $61.8 Billion. It has a total of 261 Million shares outstanding. The PE ratio for the stock is -233.5. The stock has a price/sales ratio of 9.65.

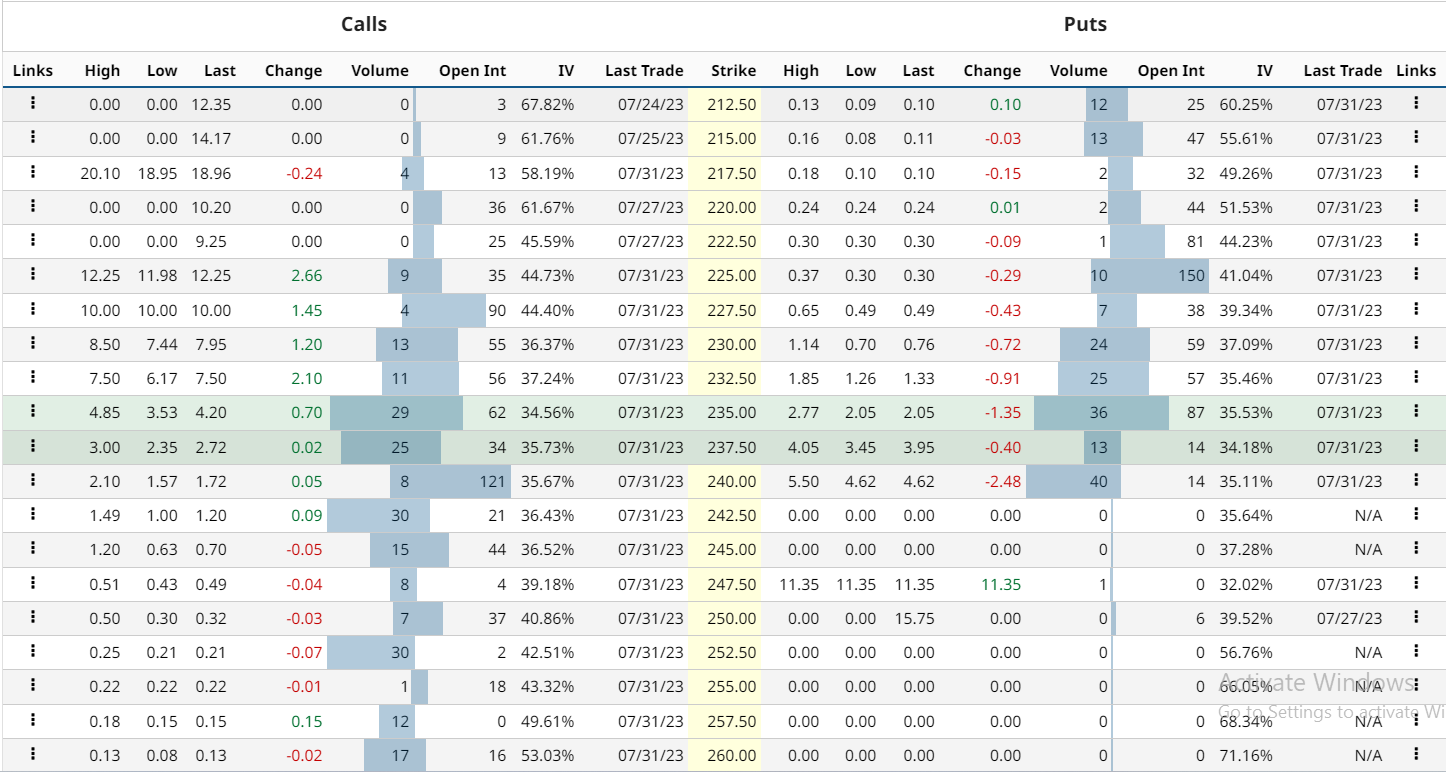
WDAY stock derivatives data states the current implied volatility in the market is 35.56% with an increment of 2.14% in the last trading session. It has a total of 73.5K open interest contracts, as of now. The PUT/CALL ratio is 1.29, indicating a strong bullish sentiment prevailing in the market, as per the data.
WDAY Stock Price Prediction Using Price Action Strategy
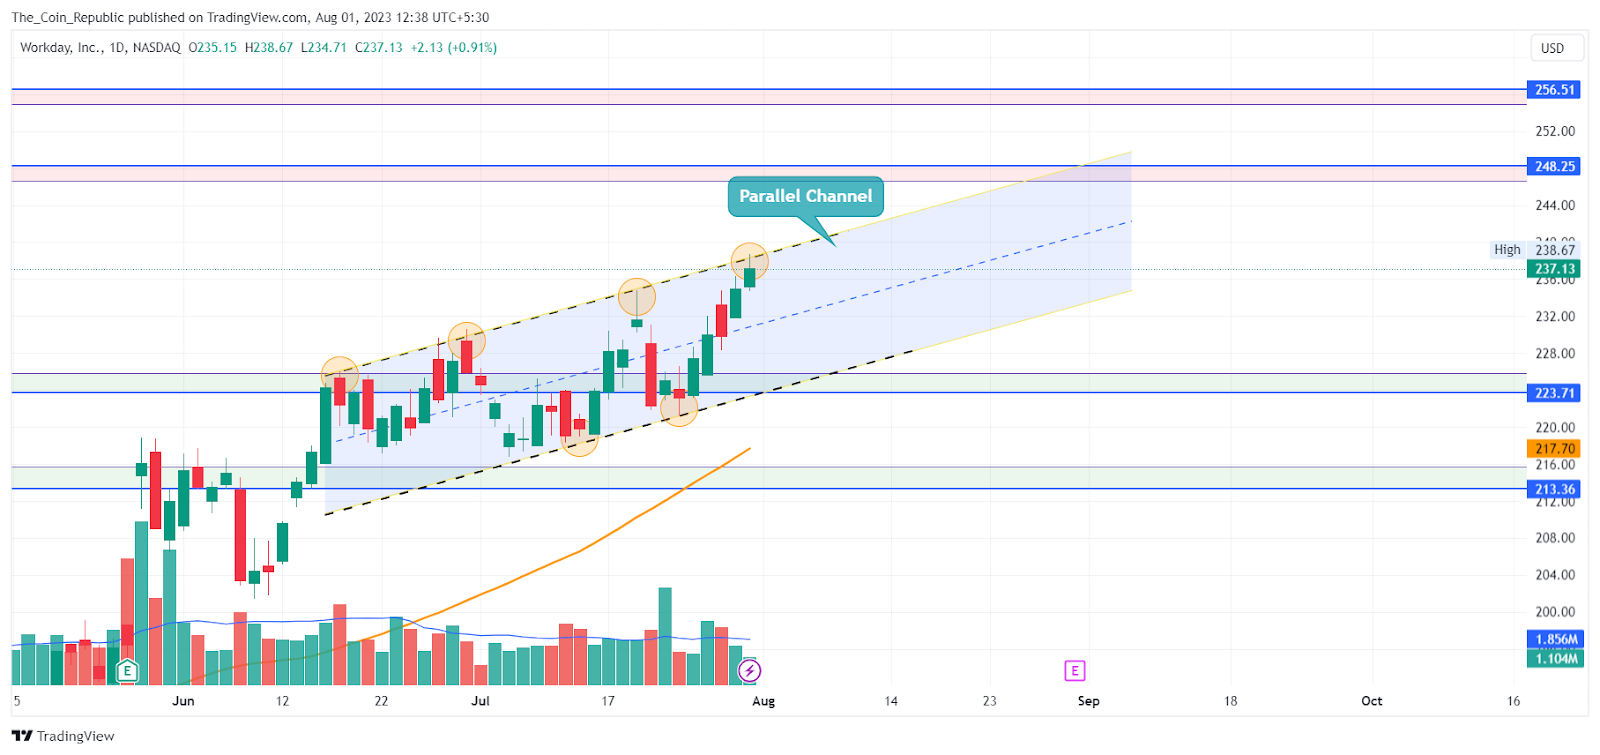
WDAY share price analysis reveals the stock has been in an uptrend after bottoming out followed by a breakout in December 2022. Since then, the price is forming higher lows and inclining to form new swing highs. Since the breakout in December 2022, the stock has gained nearly 45% in the past 7 months and is surging to hit a half-century return to its investors.
Recently, the price has formed a parallel channel pattern with support and resistance at both edges and is forming higher highs.
For now, the price is not much volatile, and it is expected to maintain its price and sustain in the channel. The price may suffer rejection from the upper edge and gain support from the lower edge of the channel. The stock may try to maintain its ongoing trend until it remains in the channel.
WDAY Share Price Forecast from Indicators’ Point of View
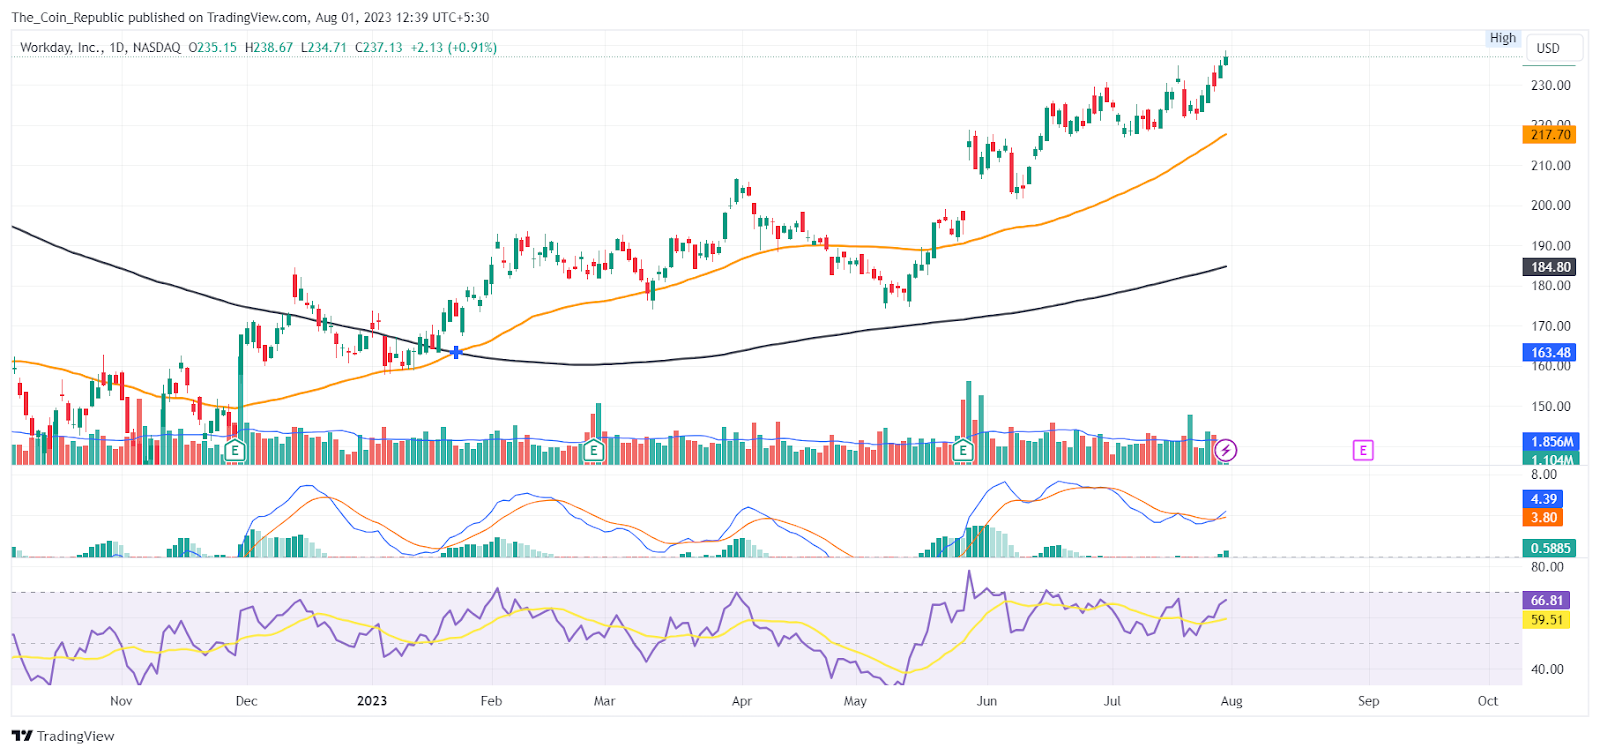
As per the EMA analysis, the WDAY stock price is trading above the 50 EMA and surged higher after getting support, which indicates the short-term presence of buyers in the market. Also, the price is trading above the 200 EMA, which shows a long-term positive sentiment prevailing in the market.
At the time of publishing, the RSI value of the WDAY share price is 66.81 and that of the SMA line is 59.51. RSI is showing a divergence, which indicates a possible correction in the market.
Conclusion
WDAY stock has been in an uptrend after bottoming out followed by a breakout in December 2022. Since the breakout in December 2022, the stock has gained nearly 45% in the past 7 months and is surging to hit a half-century return to its investors.
Currently, the price is maintaining a parallel channel and surging higher by forming higher lows and higher highs. For now, the price may try to maintain its ongoing trend until it remains in the channel. The price may take a pullback and surge to form a new swing high.
Technical Levels
- Support levels: $223.71 and $213.36.
- Resistance levels: $248.25 and $256.51.
Disclaimer
The views and opinions stated by the author, or any people named in this article, are for informational purposes only and do not establish financial, investment, or other advice. Investing in or trading crypto or stock comes with a risk of financial loss.

Adarsh Singh is a true connoisseur of Defi and Blockchain technologies, who left his job at a “Big 4” multinational finance firm to pursue crypto and NFT trading full-time. He has a strong background in finance, with MBA from a prestigious B-school. He delves deep into these innovative fields, unraveling their intricacies. Uncovering hidden gems, be it coins, tokens or NFTs, is his expertise. NFTs drive deep interest for him, and his creative analysis of NFTs opens up engaging narratives. He strives to bring decentralized digital assets accessible to the masses.


