
 Home
Home News
News

- 1 PAX Gold price is currently trading at $1939 while observing a loss of -0.46% during the intraday trading session.
- 2 PAXG price trades above 20,50,100 and 200-day EMAs.
- 3 The year-to-date return of Pax Gold is 6.42% while the three-month return is -5.14%.
PAX Gold (PAXG) price has been trending upward since the start of July 2023 after the formation of a support level at $1890. The cryptocurrency price has been on its journey towards $2000.
Recently, the price faced strong rejection from $1968 and the move was halted. Bulls formed support at the $1940 level and tried to retest but could not close above $1960.

The previous candle closed bearish with a long lower wick indicating that bulls are striving to hold a price above $1940. However, the current candle broke the low of the previous candle indicating chances of the price melting toward the $1920 level causing a downfall of 0.77%.
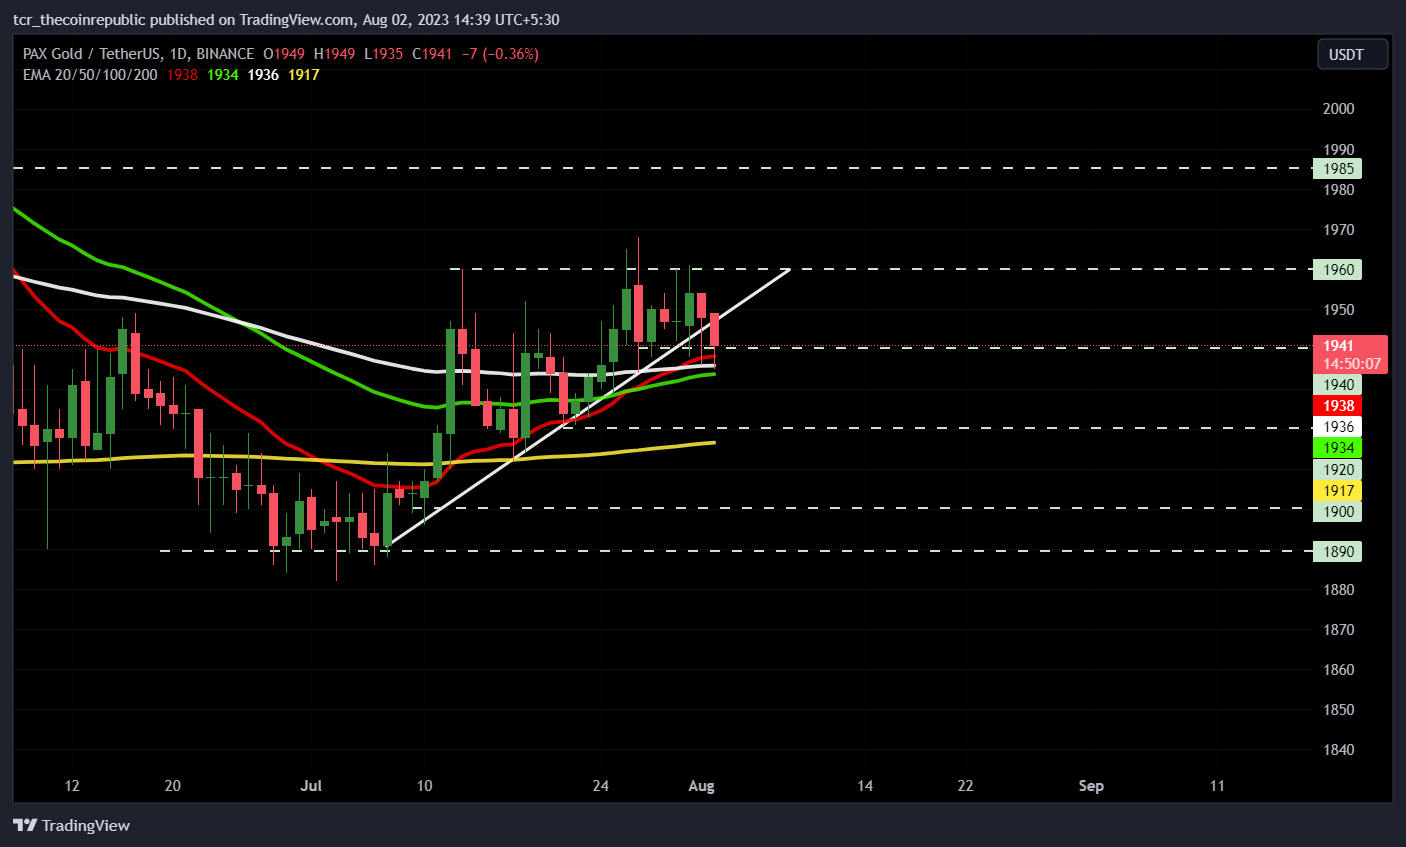
If the current candle can close below $1940, it would provide slight confirmation regarding the downward move. PAX Gold has already broken the upward trend line. On the other hand, if the price is successful in forming support at $1940, there is the possibility that the price might retest $1960.
The market capitalization has dropped by 0.44% to $481,207,500. The 24-hour trading volume has increased by 17.46%. The price is down by 44.44% from the all-time high of $3,487 and up by 39.6% from the all-time low of $1387.
Will PAXG Price Fall to $1900?
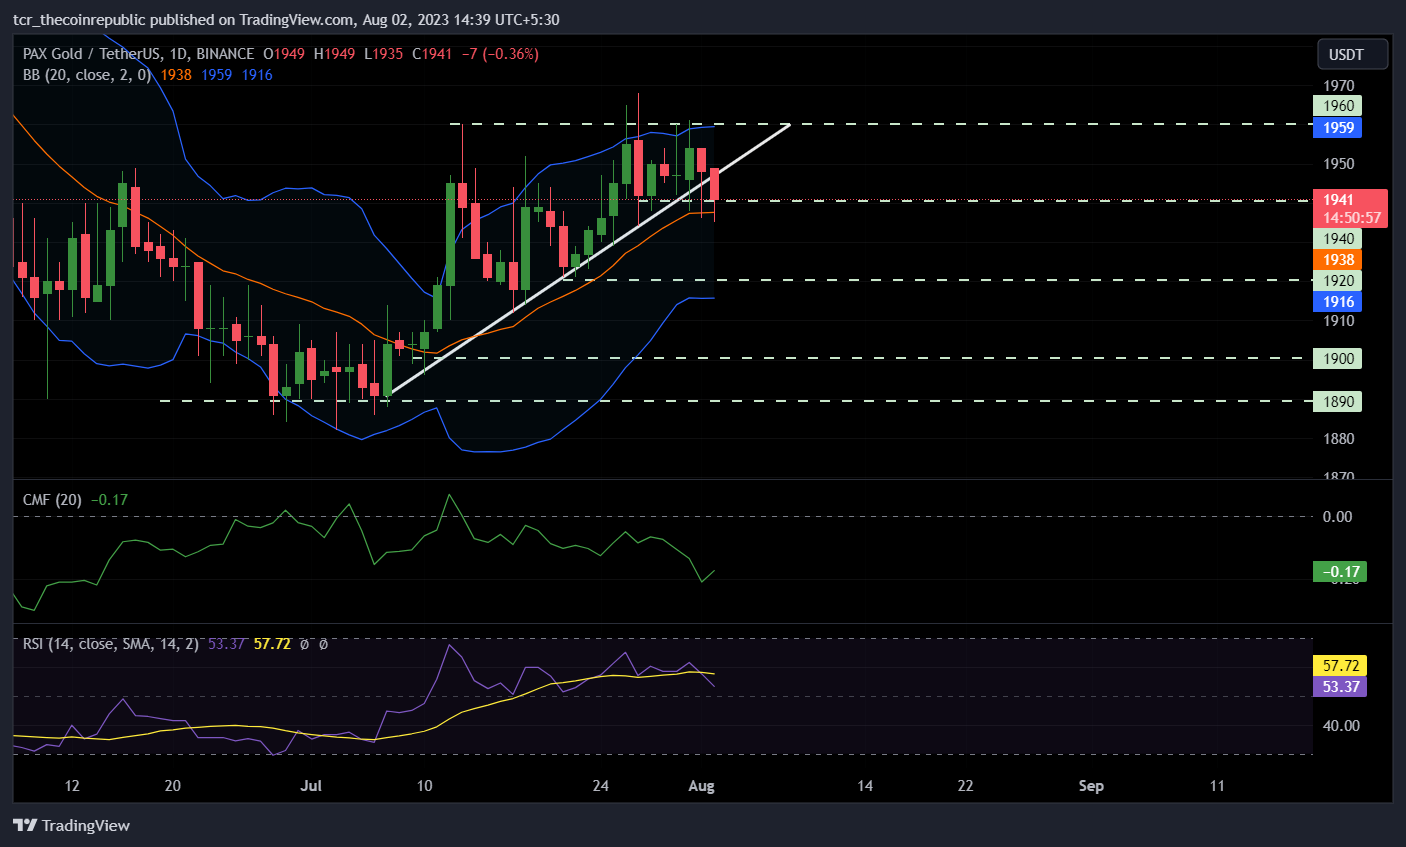
The cryptocurrency price trades above 20, 50,100, and 200-day exponential moving averages (EMAs), indicating bullish momentum. Chaikin money flow (CMF) score has dropped below the 0 mark and is currently trading at -0.18 suggesting weakness in the market. CMF has been trading below the 0 mark since 13 July 2023.
The relative strength index is trading at 51.71, nearing the neutral territory. RSI is indicating that there is still the presence of bulls in the market. The Bollinger bands have expanded, indicating a rise in volatility in the market. The 20-day SMA has been acting as a support for the price since the start of the uptrend.
If it breaks below the 20-day SMA, there is a chance that the price might head toward the lower band of Bollinger which resides near $1920. The long/short ratio is 0.62 with 38.34% longs and 61.66% shorts indicating the dominance of sellers in the last 24 hours.
Conclusion
The market structure and price have turned bearish after facing strong rejection above $1960. The cryptocurrency price has also broken the trend line which indicates the possibility of a downward move toward $1900. Technical parameters suggest that there is a decrease in bullish pressure.
Technical Levels
- Major support: $1920 and $1900
- Major resistance: $1960 and $1985
Disclaimer
The views and opinions stated by the author, or any people named in this article, are for informational purposes only. They do not establish financial, investment, or other advice. Investing in or trading crypto assets comes with a risk of financial loss.
Steve Anderson is an Australian crypto enthusiast. He is a specialist in management and trading for over 5 years. Steve has worked as a crypto trader, he loves learning about decentralisation, understanding the true potential of the blockchain.


