
 Home
Home News
News
- 1 UNI token recovered from the support range of $4.00 and showed a trend reversal.
- 2 Buyers persist in accumulating and are willing to catch the highs of $8.00.
Uniswap token (UNI) price shows momentum and lifting the gains gradually from the past sessions. In the past months, UNI price was in a corrective phase and sank by more than 50% from the highs of $7.500 toward the lows of $3.500. Afterward, buyers showed their interest, accumulated the token price from the demand zone, and noted a reversal.
The price action shows that buyers have regained strength and continue showing aggressiveness by lifting the token price above the significant moving averages. This indicates that the UNI price has attained strong momentum and is ready to glimpse further bullishness.
Moreover, the trajectory of the token indicates that above the $6.00 spot, the token entered the bullish region, and further short-covering moves could be seen in the upcoming sessions.
The chart shows a rising wedge pattern and price trading near the upper trendline, indicating buyers have attained momentum and held the gains decisively. Furthermore, buyers are gaining traction and are willing to retest $7.00 in the upcoming sessions.
At press time, the UNI token price is trading at $6.57 with an intraday gain of 2.12%, showing bullishness on the charts. Moreover, the intraday trading volume increased by 3.10% to $132.84 Million, and the pair of UNI/BTC is at 0.000222 BTC. The market cap of UNI is $5.54 Billion.
UNI Price Action on Daily Charts
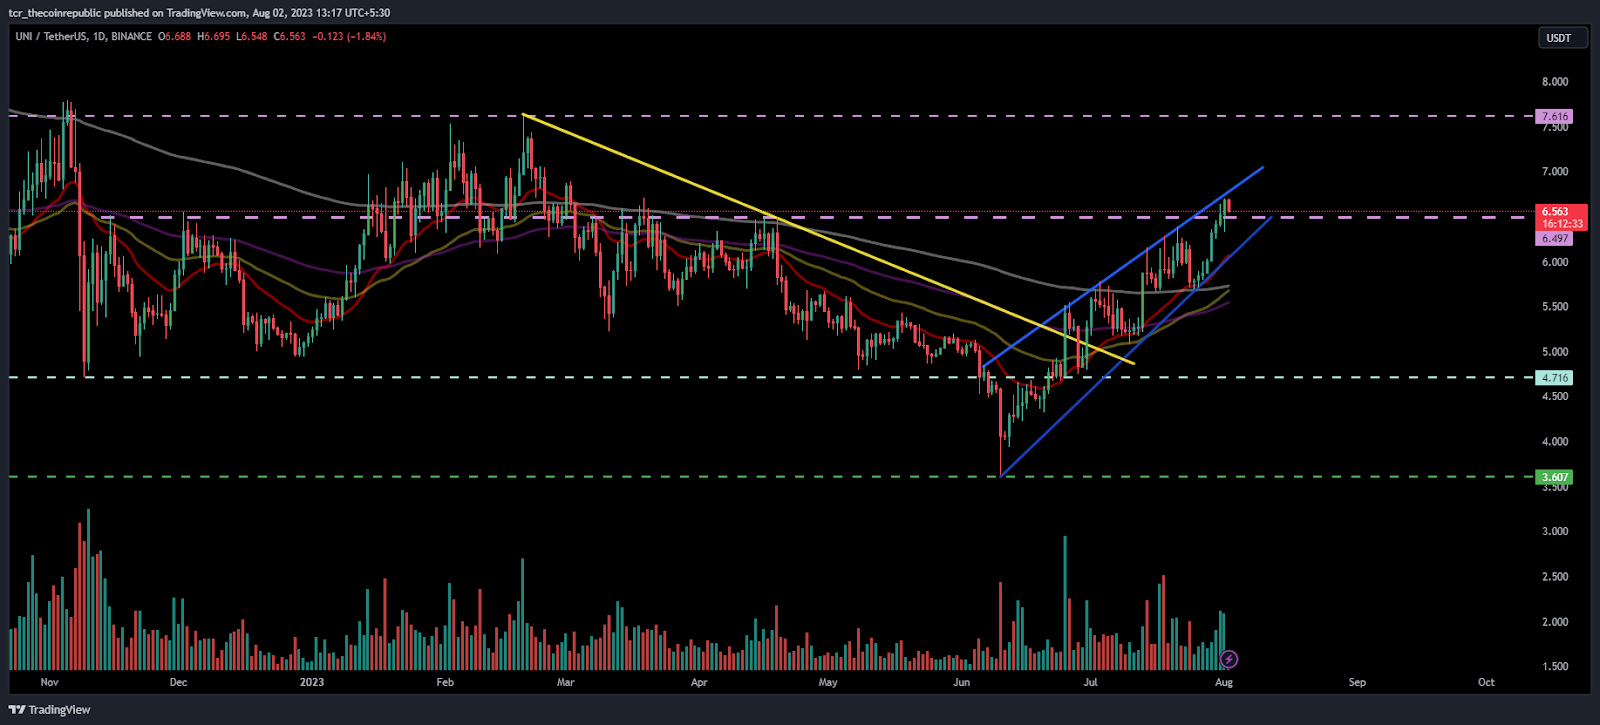
On the daily charts, the UNI token price reversed from the support of $4.00 and regained neutrality. Furthermore, the price action indicates that a rise toward the trajectory of $7.00, followed by $7.500, can be seen in the upcoming sessions.
As per the Fib levels, the UNI price is surpassing 50% and heading toward 61.8%, which shows that the token is attaining bullishness and gaining momentum. Furthermore, the token trades near the upper bollinger band and indicates a breakout on the charts in the upcoming sessions.
What Technical Indicators Say
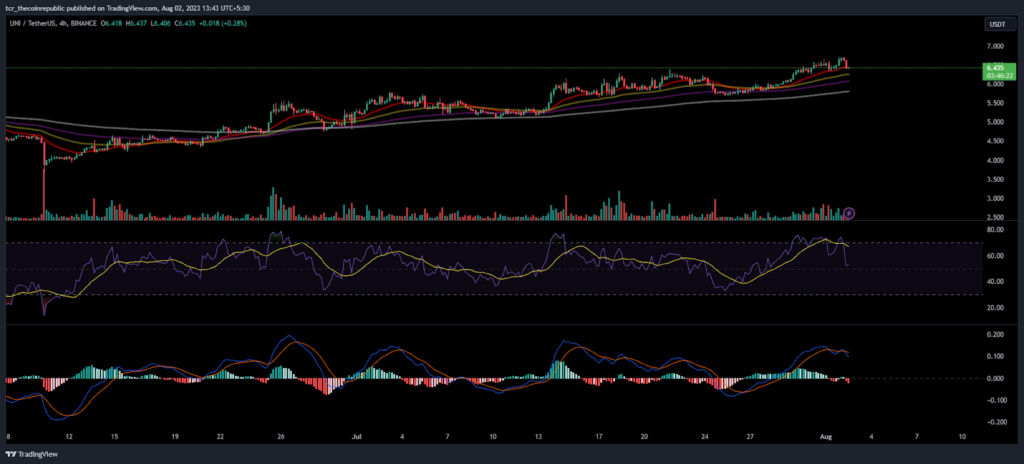
On the 4-hour charts, the UNI token price is rising and forming higher highs from the past sessions. Moreover, the technical indicators suggest that buyers are making long positions and continuing to accumulate, resulting in the rising move of the token price.
The RSI curve stayed in the overbought zone but paused the rally on the charts showing a negative crossover. However, the token price is still trading in the buying range, and a rise can be anticipated if the price sustains above $6.500.
The MACD indicator shows a bearish crossover showing neutrality on the charts. However, the red bars showing a volatile move on the charts indicate profit booking in the last sessions.
Conclusion
Uniswap token price shows buyers’ dominance on the charts. Moreover, the price entered the bullish regions and indicated a rise in the upcoming sessions.
Technical Levels:
Support Levels: $6.000 and $5.800
Resistance Levels:$6.600 and $7.000
Disclaimer
The views and opinions stated by the author, or any people named in this article, are for informational purposes only and do not establish financial, investment, or other advice. Investing in or trading crypto assets comes with a risk of financial loss.

Nancy J. Allen is a crypto enthusiast, with a major in macroeconomics and minor in business statistics. She believes that cryptocurrencies inspire people to be their own banks, and step aside from traditional monetary exchange systems. She is also intrigued by blockchain technology and its functioning. She frequently researches, and posts content on the top altcoins, their theoretical working principles and technical price predictions.


