
 Home
Home News
News
- 1 BCS stock showed sharp selling pressure in the last sessions.
- 2 Buyers faced rejection near $9.00 and slipped below the key moving averages.
Barclays PLC stock (NYSE: BCS) showed a sudden fall and intense selling pressure this week because of the rejection from the supply range of $9.00. Moreover, the head and shoulder pattern, whose neckline was $7.50, was noted on the charts. Furthermore, the death crossover was noted, which shows bearishness on the charts.
Recently, BCS stock released Q2 earnings results which were below the estimates. Selling pressure in the stock was witnessed, resulting in slippage below the significant moving averages, and the price retraced toward the demand zone of $7.00. In the last three sessions, BCS stock lost more than 12% gains with consecutive gap-down moves on the charts showing negative sentiments among investors.
Barclays is a universal bank headquartered in the United Kingdom. It operates via two principal segments; U.K. (38% of profit before tax) and International (62% of PBT). In its U.K. segment, the bank provides current accounts, mortgages, savings and investment management services, credit cards, and business banking services to retail clients and small and medium-sized enterprises.
The international segment includes a corporate bank offering banking solutions to large corporations, a bulge-bracket global investment bank, and a credit card and payments business. In 2018, Barclays generated roughly 52% of its income from the U.K. and 34% from the United States.
At press time, BCS stock price is trading at $7.49 with an intraday drop of 3.85% showing bearishness on the charts. Moreover, the intraday trading volume increased by 1.87% to 9.258 Million, and the market cap is $30.086 Billion. Analysts maintained a buy rating with a yearly target price of $11.85.
BCS Stock Shows Bearishness On Daily Charts
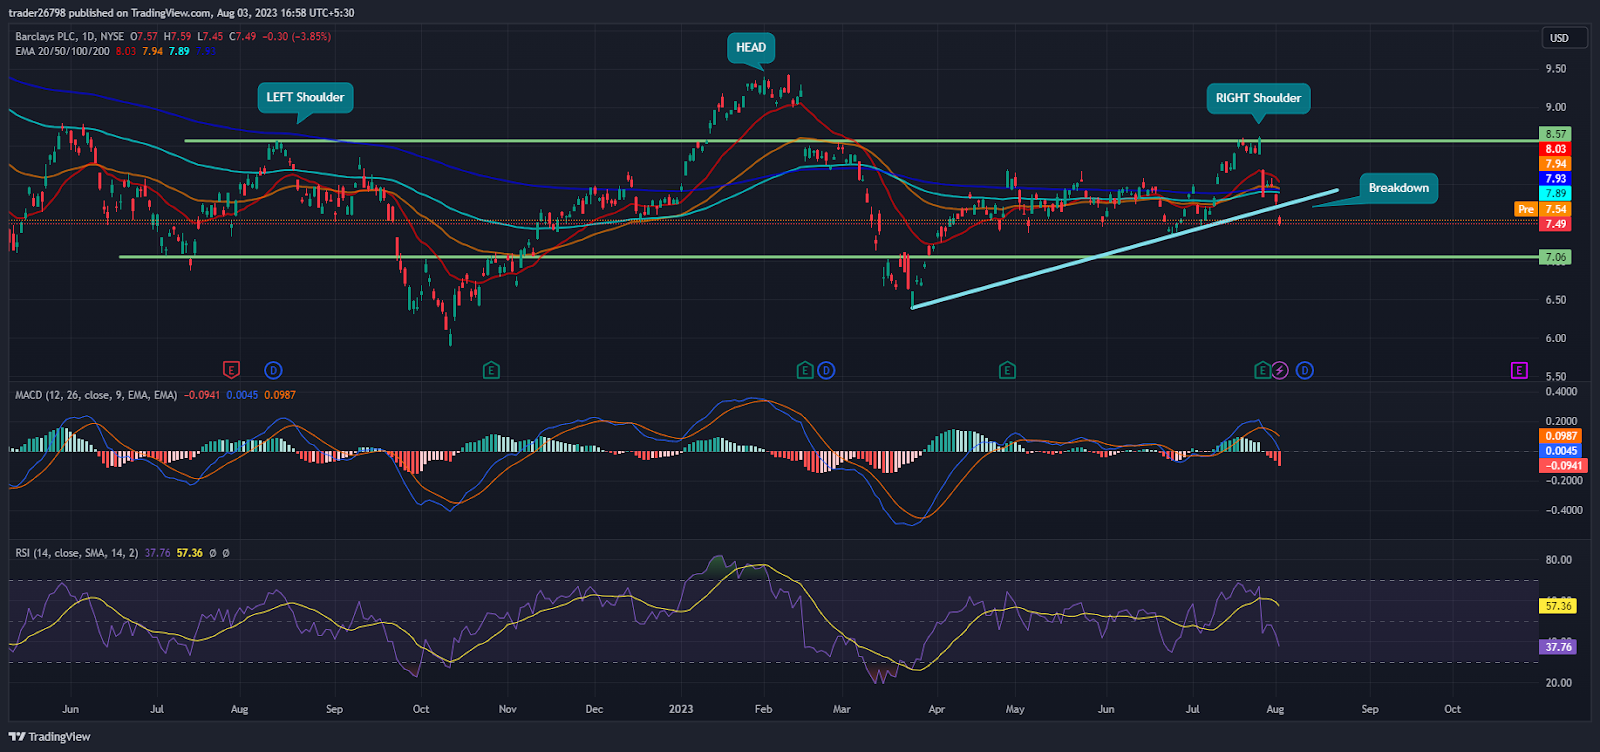
On the daily charts, BCS stock price shows bearish cues and forms a head and shoulders pattern, which was a sign of negativity in the upcoming sessions. The price slipped below the lower trendline in the last session and registered a breakdown.
As per the Fib levels, BCS stock cannot surpass 61.8% and retrace toward 50%. Furthermore, it slipped below it, heading toward 38.2%, showing intense selling pressure. Moreover, it dropped below the lower bollinger band, indicating a chart breakdown.
The RSI curve heads toward the oversold region forming a negative crossover indicating selling pressure on the charts.
The MACD indicator showed a bearish crossover, and red bars on the histogram showed sellers’ dominance and persistence in spreading the weakness from the past sessions.
Conclusion
Barclays PLC (BCS stock) showed a sudden fall from the supply range of $9.00 and intense selling pressure in the past sessions. The buyers were trapped, and sellers took advantage by making aggressive short positions and forcing the bulls to unwind their positions to exceed the correction toward $7.00.
Technical Levels:
Support Levels: $7.00 and $6.30
Resistance Levels:$8.00 and $10.00
Disclaimer
The views and opinions stated by the author, or any people named in this article, are for informational purposes only and do not establish financial, investment, or other advice. Investing in or trading crypto assets comes with a risk of financial loss.

Nancy J. Allen is a crypto enthusiast, with a major in macroeconomics and minor in business statistics. She believes that cryptocurrencies inspire people to be their own banks, and step aside from traditional monetary exchange systems. She is also intrigued by blockchain technology and its functioning. She frequently researches, and posts content on the top altcoins, their theoretical working principles and technical price predictions.


