
 Home
Home News
News
- 1 MTDR stock price slid 1.56% in the last trading session and is currently trading at $55.37.
- 2 Matador share price (NYSE: MTDR) is expensive based on its Price-To-Earnings Ratio (6.8x) compared to the peer average (4.2x).
Matador Resources Company (NYSE: MTDR) is an energy company that explores, develops, produces, and acquires oil and gas in the US. It has two segments, Exploration and Production and Midstream. The company focuses on the Wolfcamp and Bone Spring plays in the Delaware Basin in Southeast New Mexico and West Texas.
The Matador share price currently trades at $55.37, declining 1.56% in the last trading session. MTDR stock holds a market cap of 6.3 Billion. It has a total of 119,184K shares outstanding. The PE ratio for the stock is 7.36. It has a good EPS of 9.73.

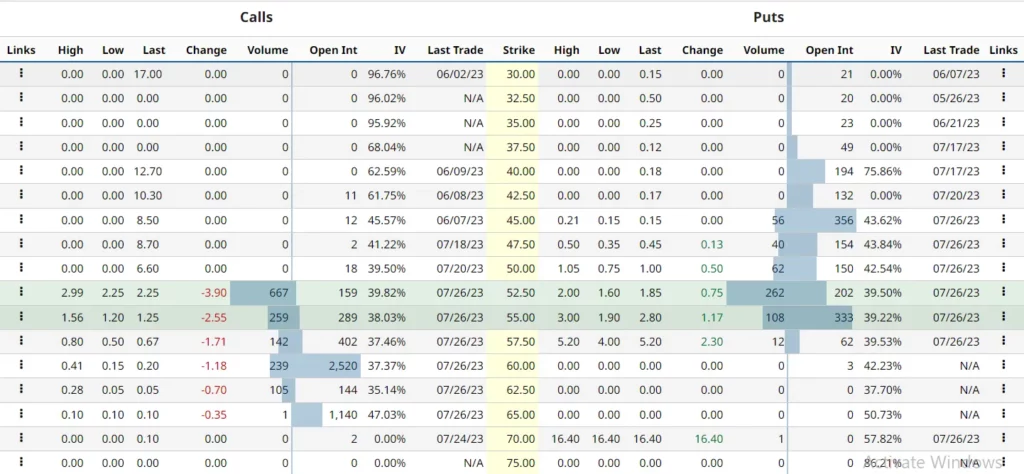
MTDR stock derivatives data states that the current implied volatility in the market is 39.24%, with a decrement of 5.87% in the last trading session. It has a total of 26.619K open interest contracts as of now. The PUT/CALL ratio is 0.53, indicating a strong bearish sentiment prevailing as per the data.
Matador Stock Price Prediction Using Price Action Strategy
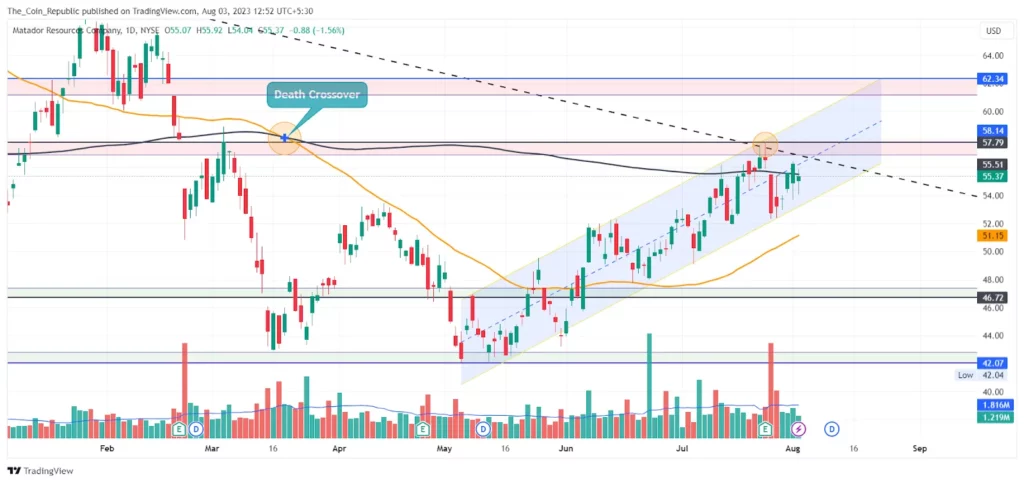
MTDR share price analysis reveals that the price had been in a correction phase after suffering rejection from an all-time high in November 2022. The price declined, forming lower highs and lower lows, and formed a low of 42.07 in May 2023.
However, the past 2 months went very fruitful for MTDR investors as the price surged nearly 32% since June 2023. The price formed higher lows and higher highs and headed upwards, thus shifting its trend to an uptrend. The price formed a channel pattern known as the bearish flag pattern.
Recently, the disclosure of quarterly results led to some profit booking but the price could not break the channel pattern and took support from the lower trendline of the channel and sustained in the channel.
Now, if the price breaks below the lower trendline of the channel, then it may show some bearishness, and the price may decline to its nearest support.
MTDR Share Price Forecast from Indicators’ point of view
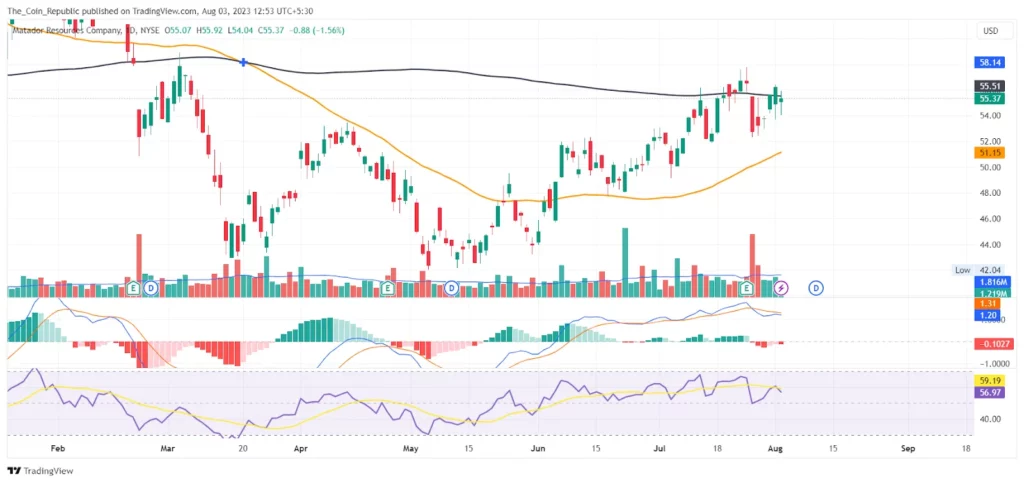
As per the EMA analysis, the MTDR stock price has suffered rejection from 200 EMA. Also, the price is still above the 50 EMA, indicating short-term buyer’s positive sentiment in the market.
At the time of publishing, the RSI value of the MTDR share price is 46.72, and that of the SMA line is 59.19. A divergence is observed in RSI, indicating a possible correction in the stock.
Conclusion
MTDR stock price prediction shows that the price has surged nearly 32% in the past 2 months and formed a bearish flag channel pattern. Recently the price suffered rejection from a strong supply zone and slid nearly 6% in the last trading session. Now, until the price remains in the channel, it may try to maintain its ongoing trend and get support from the lower levels.
However, if the price breaks and sustains below the channel, then sellers may try to dominate and drag the price may decline to its nearest support zone.
Technical Levels
- Support levels: $46.72 and $42.07.
- Resistance levels: $57.79 and $62.34.
Disclaimer
The views and opinions stated by the author, or any people named in this article, are for informational purposes only and do not establish financial, investment, or other advice. Investing in or trading crypto or stock comes with a risk of financial loss.

With a background in journalism, Ritika Sharma has worked with many reputed media firms focusing on general news such as politics and crime. She joined The Coin Republic as a reporter for crypto, and found a great passion for cryptocurrency, Web3, NFTs and other digital assets. She spends a lot of time researching and delving deeper into these concepts around the clock, and is a strong advocate for women in STEM.


