
 Home
Home News
News
- 1 ATOM price faced rejection from the hurdle of $10.00 in the past sessions.
- 2 Buyers cannot hold the gains and are falling below the 20-day EMA.
Cosmos (ATOM) price faced selling pressure and bearishness in the past few sessions. Presently, the price is hovering near the support zone of $8.00. However, buyers attempted to leave the congestion zone and tried to surpass the prompt hurdle of $10.00 but faced rejection multiple times. Moreover, buyers cannot sustain at the 20-day EMA mark and slipped below it, showing weakness on the charts. Furthermore, if the price slips below the neckline of $8.00, it will retest the demand zone of $7.00 in the upcoming sessions.
The chart shows that the ATOM price could not surpass the trendline and faced rejection resulting in slippage below the 20-day EMA. Furthermore, the price action favors the sellers who have produecd a short buildup. Buyers tried to retrieve gains but failed.
Moreover, the chart showcases a rounding top pattern which is a sign of bearishness, and if follow-on selling arises, it will retest $7.00. In the past sessions, a long rejection wick from the demand zone was shown on the charts, and sellers tried to retest the region in the following sessions.
At press time, ATOM price is trading at $8.60 with an intraday drop of 1.00% showing bearishness on the charts. Moreover, the pair of ATOM/BTC is at $0.000295 BTC. The trading volume increased by 2.31% to $80.20 Million. The market cap of ATOM is $2.83 Billion.
Cosmos (ATOM) Price Action On Daily Charts
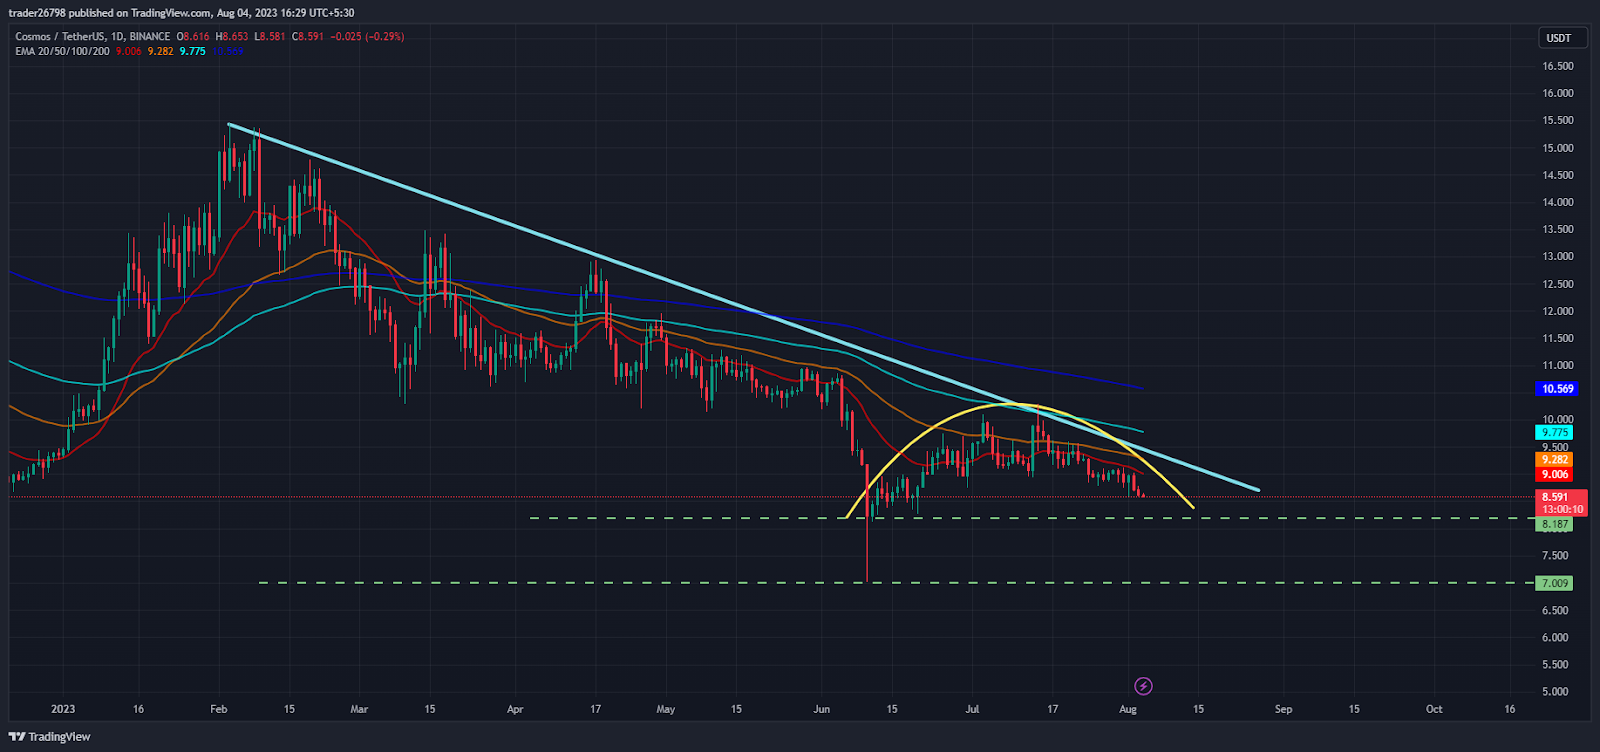
On the daily charts, ATOM price showed rejection from the downward trendline near $10.00, retracing toward the strong support of $7.00. Moreover, the leading indicators indicate a negative outlook based on the selling pressure from the top. ATOM price noted a drop of over 45% in the past four months and showed correction from the top.
As per the Fib levels, ATOM price is trading in the oversold region near 23.6% and still indicates a fall in the upcoming sessions. Moreover, the price is on the verge of the lower bollinger band showing a hawkish chart structure.
Short Term Charts Shows Bearish Structure
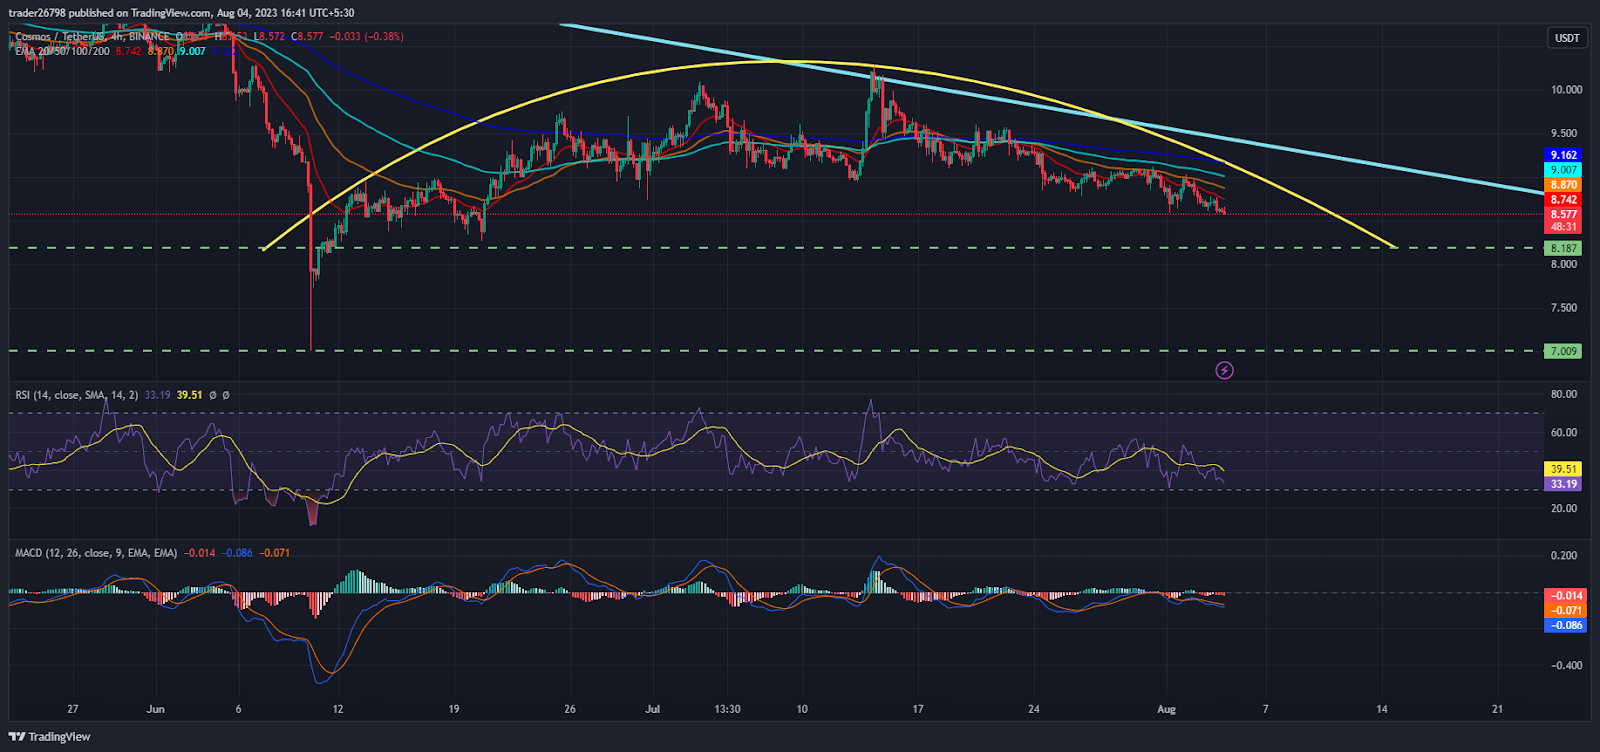
On the 4-hour charts, ATOM price shows selling pressure, and every bounce was sold in the past sessions. Sellers have maintained a firm grip near the round spot of $10.00 and did not permit it to surpass it.
The RSI curve stayed in the sellers’ region, and a negative crossover was formed on the charts, which indicates seller dominance.
The MACD indicator showed a bearish crossover and red bars on the histogram persisted on the charts, indicating a negative outlook.
Conclusion
Cosmos (ATOM) price is trading in the oversold region and below the significant moving averages showing bearishness on the charts. Moreover, the price action indicates a fall toward the demand zone of $7.00 in the following sessions.
However, the trajectory shows that the neckline of $8.00 needs to be broken for a fall. If it fails, it will lead to a bounce toward the resistance of $10.00.
Technical Levels:
Support Levels: $8.00 and $7.30
Resistance Levels: $10.00
Disclaimer
The views and opinions stated by the author, or any people named in this article, are for informational purposes only and do not establish financial, investment, or other advice. Investing in or trading crypto assets comes with a risk of financial loss.

Andrew is a blockchain developer who developed his interest in cryptocurrencies while pursuing his post-graduation major in blockchain development. He is a keen observer of details and shares his passion for writing, along with coding. His backend knowledge about blockchain helps him give a unique perspective to his writing skills, and a reliable craft at explaining the concepts such as blockchain programming, languages and token minting. He also frequently shares technical details and performance indicators of ICOs and IDOs.


