


 Hovers In Range: Can FTM Breach $0.800 Mark?")

The price data of the FTM coin shows that it is in a falling trend right now. Fantom price dropped by 4.32% in the past seven days. It plunged 93.20% from its high price of $3.46 in the last 2 years. The market is dominated by the bears.
FTM price had bounced off its major trendline support level toward a resistance level. The price might have risen to the next resistance level if it had broken the trendline. The price may fall back to the current support if it faces resistance.
The trendline and the resistance are important levels to watch for in the price chart. A breakout or a breakdown from these levels could signal a significant move in the market. Traders should be cautious and wait for confirmation before entering a trade.
Fantom (FTM) Technical Analysis
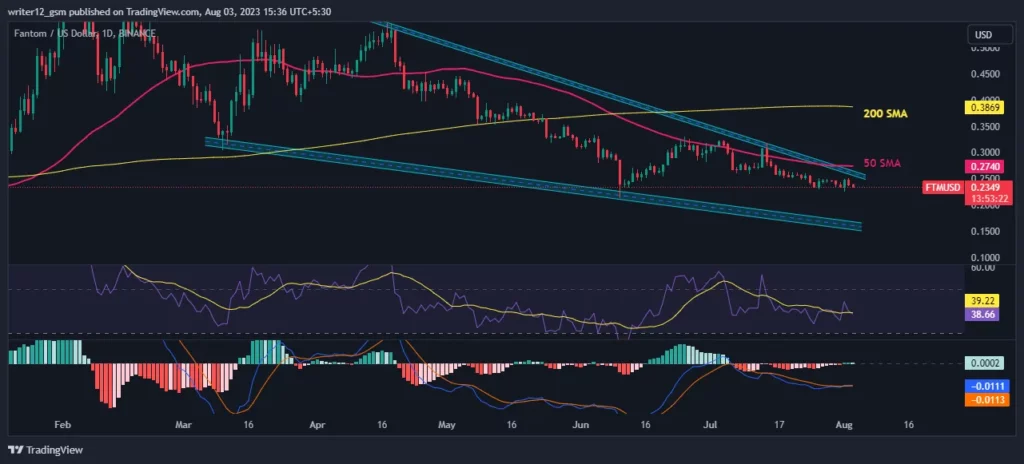
Fantom (FTM) is in a bearish trend as it has fallen below the 50 and 200 EMAs. The coin may drop more next week if the seller maintains the pressure. The coin has been trading near 200 days EMA again, indicating that the bears are not willing to let the bulls take over. A death cross occurred between 50-day and 200-day EMAs.
The MACD is negative at 0.0111 and below the signal line at 0.0114, indicating that the MACD is below the zero line and signaling more downside potential.
The RSI is at 38.51 points and below the 50 level, suggesting that the market is bearish. The 14 SMA line is also below the middle line at 39.21 points, confirming the bearish momentum. The market is pessimistic as the price is in the oversold zone.
Conclusion
FTM is struggling. The price may drop further in the next few days if it breaks its main trendline support level. FTM price is showing a negative scenario right now. Key indicators like EMA, RSI, and MACD are bearish on the Fantom coin. The investors are scared because of the weak performance of the coin. There are no signs of recovery right now, but it may rebound if there’s a volume spike.
Technical Levels-
Support Level: $0.222.
Resistance Level: $0.3227.


